29
/
en
AIzaSyAYiBZKx7MnpbEhh9jyipgxe19OcubqV5w
April 1, 2024
275498
United Kingdom
GBR
true
2
1
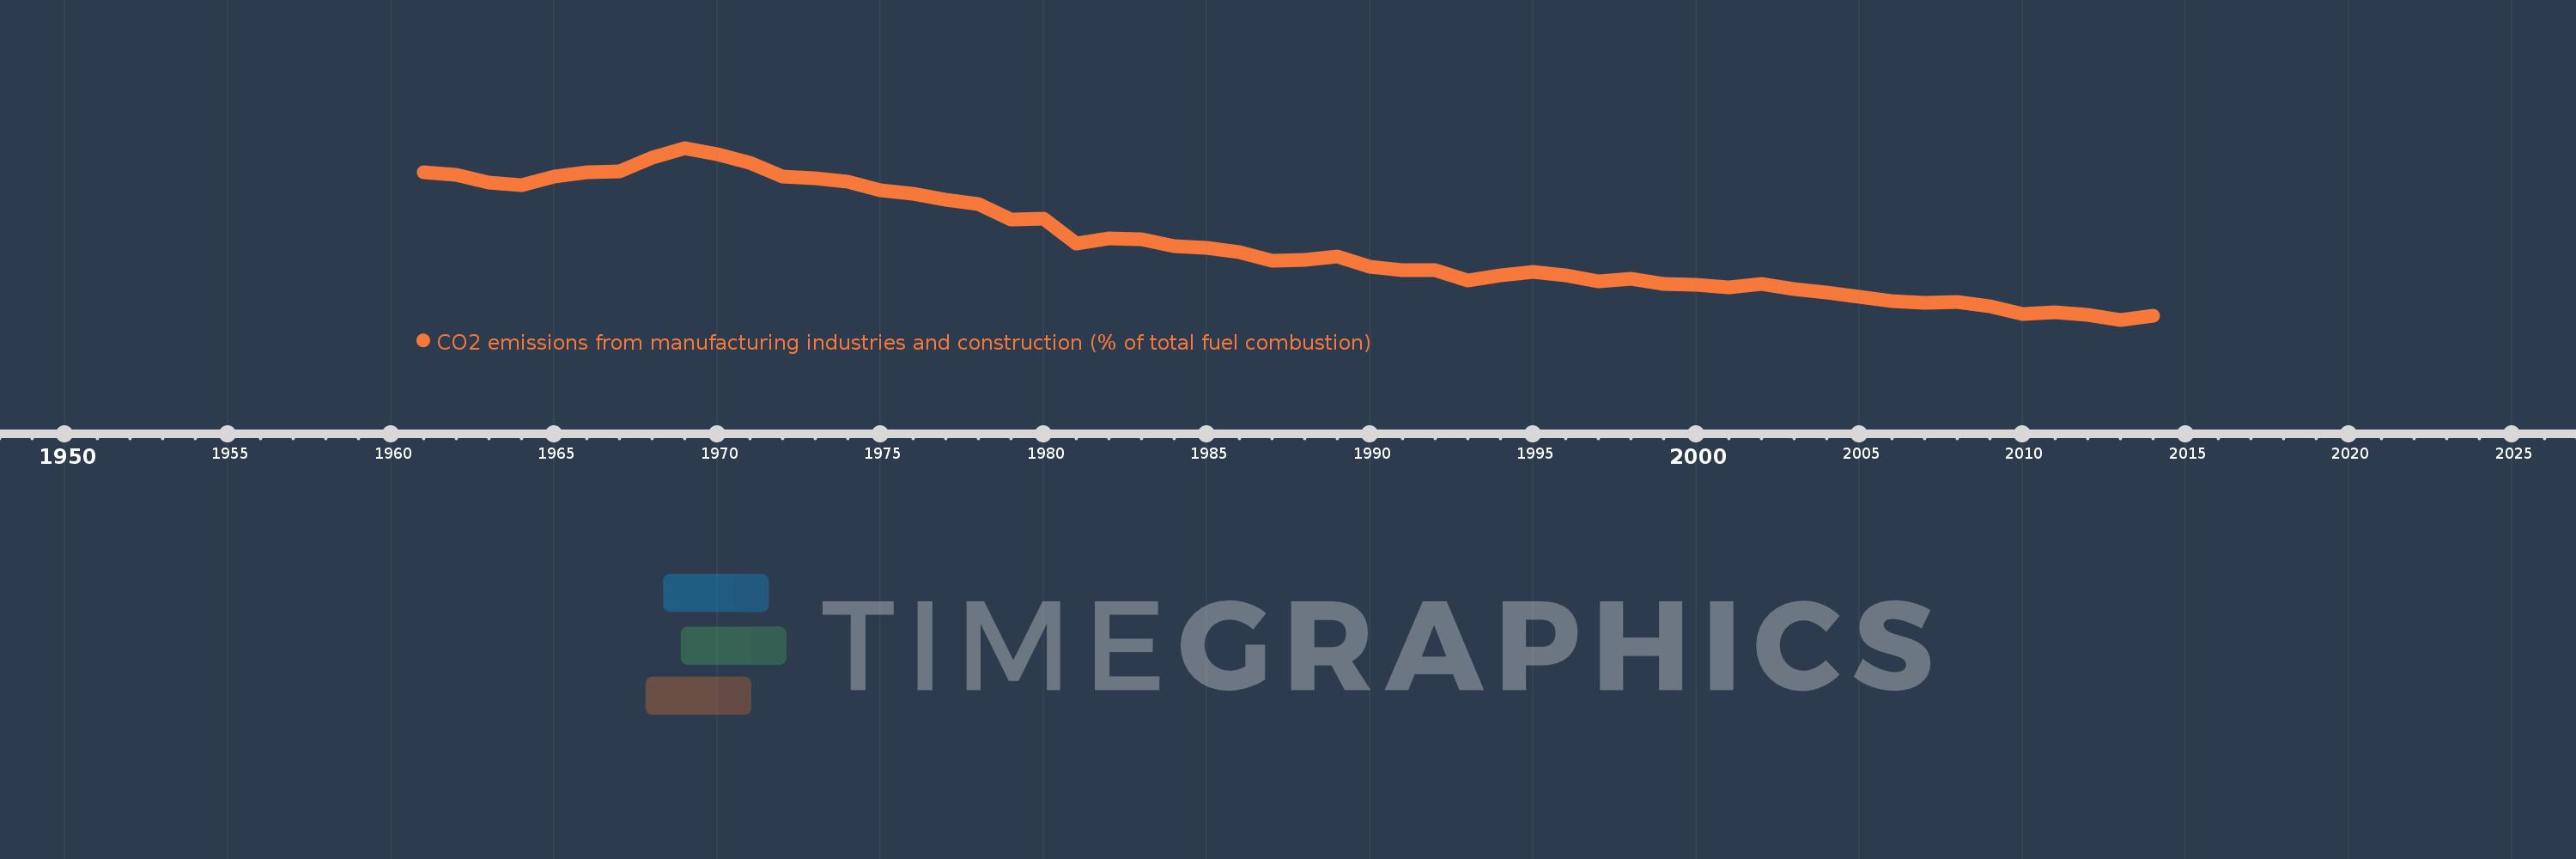
CO2 emissions from manufacturing industries and construction (% of total fuel combustion)
2014,2013,2012,2011,2010,2009,2008,2007,2006,2005,2004,2003,2002,2001,2000,1999,1998,1997,1996,1995,1994,1993,1992,1991,1990,1989,1988,1987,1986,1985,1984,1983,1982,1981,1980,1979,1978,1977,1976,1975,1974,1973,1972,1971,1970,1969,1968,1967,1966,1965,1964,1963,1962,1961
This statistics in other country:
AlbaniaAlgeriaAngolaArab WorldArgentinaArmeniaAustraliaAustriaAzerbaijanBahrainBangladeshBelarusBelgiumBeninBoliviaBosnia and HerzegovinaBotswanaBrazilBrunei DarussalamBulgariaCambodiaCameroonCanadaCaribbean small statesCentral Europe and the BalticsChileChinaColombiaCongo, Dem. Rep.Congo, Rep.Costa RicaCote d'IvoireCroatiaCubaCuracaoCyprusCzech RepublicDenmarkDominican RepublicEarly-demographic dividendEast Asia & PacificEast Asia & Pacific (excluding high income)East Asia & Pacific (IDA & IBRD countries)EcuadorEgypt, Arab Rep.El SalvadorEritreaEstoniaEthiopiaEuro areaEurope & Central AsiaEurope & Central Asia (excluding high income)Europe & Central Asia (IDA & IBRD countries)European UnionFinlandFragile and conflict affected situationsFranceGabonGeorgiaGermanyGhanaGibraltarGreeceGuatemalaHaitiHeavily indebted poor countries (HIPC)High incomeHondurasHong Kong SAR, ChinaHungaryIBRD onlyIcelandIDA & IBRD totalIDA blendIDA onlyIDA totalIndiaIndonesiaIran, Islamic Rep.IraqIrelandIsraelItalyJamaicaJapanJordanKazakhstanKenyaKorea, Dem. People’s Rep.Korea, Rep.KosovoKuwaitKyrgyz RepublicLate-demographic dividendLatin America & Caribbean Latin America & Caribbean (excluding high income)Latin America & the Caribbean (IDA & IBRD countries)LatviaLeast developed countries: UN classificationLebanonLibyaLithuaniaLow & middle incomeLow incomeLower middle incomeLuxembourgMacedonia, FYRMalaysiaMaltaMauritiusMexicoMiddle East & North AfricaMiddle East & North Africa (excluding high income)Middle East & North Africa (IDA & IBRD countries)Middle incomeMoldovaMongoliaMontenegroMoroccoMozambiqueMyanmarNamibiaNepalNetherlandsNew ZealandNicaraguaNigerNigeriaNorth AmericaNorwayOECD membersOmanOther small statesPakistanPanamaParaguayPeruPhilippinesPolandPortugalPost-demographic dividendPre-demographic dividendQatarRomaniaRussian FederationSaudi ArabiaSenegalSerbiaSingaporeSlovak RepublicSloveniaSmall statesSouth AfricaSouth AsiaSouth Asia (IDA & IBRD)South SudanSpainSri LankaSub-Saharan Africa Sub-Saharan Africa (excluding high income)Sub-Saharan Africa (IDA & IBRD countries)SudanSwedenSwitzerlandSyrian Arab RepublicTajikistanTanzaniaThailandTogoTrinidad and TobagoTunisiaTurkeyTurkmenistanUkraineUnited Arab EmiratesUnited KingdomUnited StatesUpper middle incomeUruguayUzbekistanVenezuela, RBVietnamWorldYemen, Rep.ZambiaZimbabwe Timeline:
This timeline shows a graph from 1961 to 2014 of United Kingdom. No data until 1960. Number of actual observations by date: 54.
Source name:
World Development Indicators
Source organization:
IEA Statistics © OECD/IEA 2014 (http://www.iea.org/stats/index.asp), subject to https://www.iea.org/t&c/termsandconditions/
Categories, topics:
Environment
Last updated:
apr 23, 2017
Indicators value changes by year
Maximum:
28.515
jan 1, 1969
At the date of observation
Value
Absolute change
Change from previous value
jan 1, 1961
25.671
+25.671
0.0%
jan 1, 1962
25.376
-0.296
-1.15%
jan 1, 1963
24.453
-0.923
-3.64%
jan 1, 1964
24.095
-0.358
-1.46%
jan 1, 1965
25.102
+1.007
4.18%
jan 1, 1966
25.645
+0.543
2.16%
jan 1, 1967
25.725
+0.08
0.31%
jan 1, 1968
27.341
+1.615
6.28%
jan 1, 1969
28.515
+1.174
4.29%
jan 1, 1970
27.76
-0.755
-2.65%
jan 1, 1971
26.775
-0.985
-3.55%
jan 1, 1972
25.176
-1.6
-5.98%
jan 1, 1973
24.888
-0.288
-1.14%
jan 1, 1974
24.522
-0.366
-1.47%
jan 1, 1975
23.467
-1.055
-4.3%
jan 1, 1976
23.093
-0.373
-1.59%
jan 1, 1977
22.412
-0.682
-2.95%
jan 1, 1978
21.899
-0.513
-2.29%
jan 1, 1979
20.091
-1.807
-8.25%
jan 1, 1980
20.167
+0.076
0.38%
jan 1, 1981
17.2
-2.967
-14.71%
jan 1, 1982
17.817
+0.618
3.59%
jan 1, 1983
17.694
-0.123
-0.69%
jan 1, 1984
16.933
-0.761
-4.3%
jan 1, 1985
16.683
-0.25
-1.48%
jan 1, 1986
16.156
-0.526
-3.16%
jan 1, 1987
15.167
-0.989
-6.12%
jan 1, 1988
15.304
+0.137
0.9%
jan 1, 1989
15.652
+0.348
2.27%
jan 1, 1990
14.432
-1.219
-7.79%
jan 1, 1991
14.046
-0.387
-2.68%
jan 1, 1992
14.099
+0.054
0.38%
jan 1, 1993
12.888
-1.212
-8.59%
jan 1, 1994
13.489
+0.601
4.66%
jan 1, 1995
13.865
+0.376
2.79%
jan 1, 1996
13.468
-0.398
-2.87%
jan 1, 1997
12.747
-0.72
-5.35%
jan 1, 1998
13.061
+0.313
2.46%
jan 1, 1999
12.478
-0.583
-4.46%
jan 1, 2000
12.32
-0.158
-1.27%
jan 1, 2001
12.092
-0.227
-1.84%
jan 1, 2002
12.417
+0.325
2.69%
jan 1, 2003
11.837
-0.58
-4.67%
jan 1, 2004
11.464
-0.373
-3.15%
jan 1, 2005
10.93
-0.534
-4.66%
jan 1, 2006
10.396
-0.534
-4.88%
jan 1, 2007
10.24
-0.157
-1.51%
jan 1, 2008
10.273
+0.034
0.33%
jan 1, 2009
9.8
-0.473
-4.61%
jan 1, 2010
8.849
-0.951
-9.7%
jan 1, 2011
9.091
+0.242
2.73%
jan 1, 2012
8.766
-0.325
-3.57%
jan 1, 2013
8.217
-0.55
-6.27%
jan 1, 2014
8.734
+0.517
6.3%
Ranking of countries by current statistics by years


Comments: