29
/
en
AIzaSyAYiBZKx7MnpbEhh9jyipgxe19OcubqV5w
April 1, 2024
76931
Bahrain
BHR
true
2
1
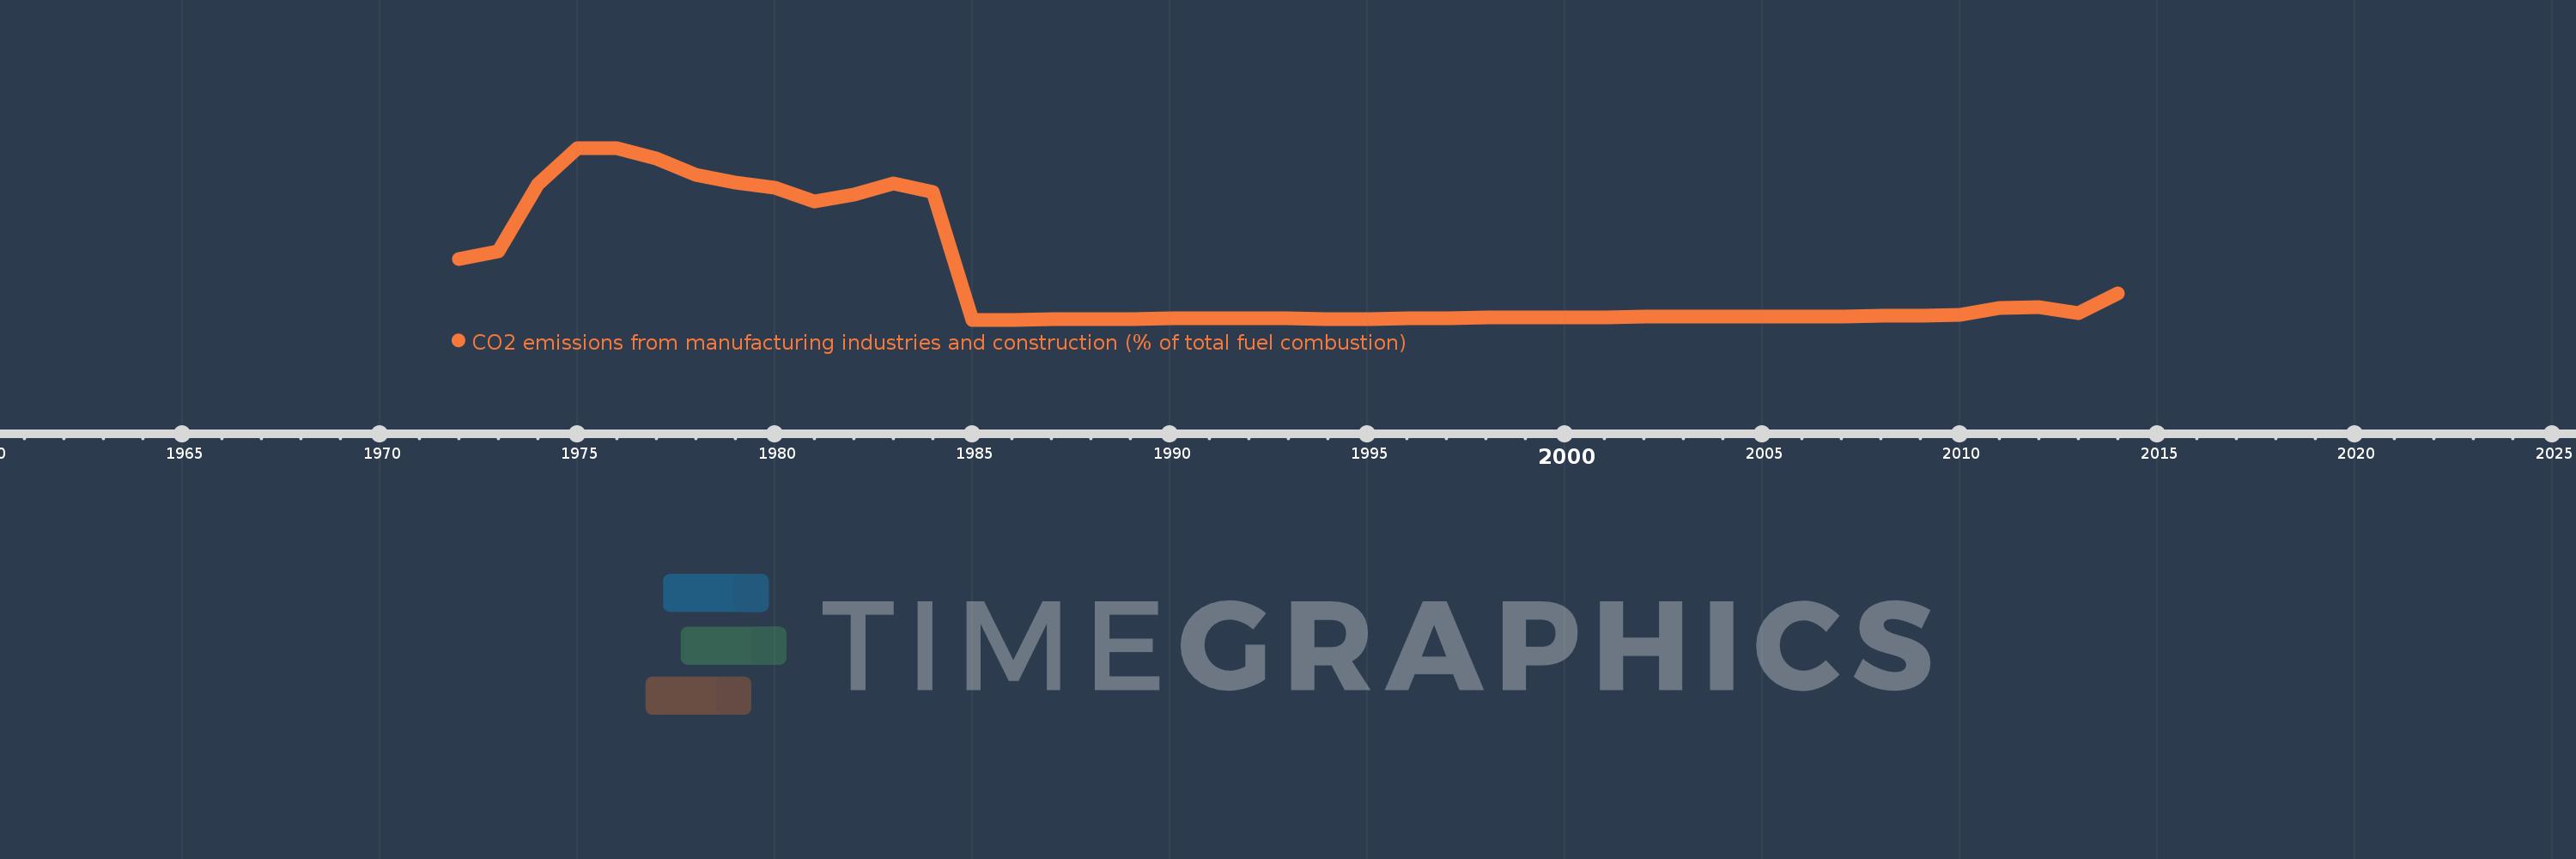
CO2 emissions from manufacturing industries and construction (% of total fuel combustion)
2014,2013,2012,2011,2010,2009,2008,2007,2006,2005,2004,2003,2002,2001,2000,1999,1998,1997,1996,1995,1994,1993,1992,1991,1990,1989,1988,1987,1986,1985,1984,1983,1982,1981,1980,1979,1978,1977,1976,1975,1974,1973,1972
This statistics in other country:
AlbaniaAlgeriaAngolaArab WorldArgentinaArmeniaAustraliaAustriaAzerbaijanBahrainBangladeshBelarusBelgiumBeninBoliviaBosnia and HerzegovinaBotswanaBrazilBrunei DarussalamBulgariaCambodiaCameroonCanadaCaribbean small statesCentral Europe and the BalticsChileChinaColombiaCongo, Dem. Rep.Congo, Rep.Costa RicaCote d'IvoireCroatiaCubaCuracaoCyprusCzech RepublicDenmarkDominican RepublicEarly-demographic dividendEast Asia & PacificEast Asia & Pacific (excluding high income)East Asia & Pacific (IDA & IBRD countries)EcuadorEgypt, Arab Rep.El SalvadorEritreaEstoniaEthiopiaEuro areaEurope & Central AsiaEurope & Central Asia (excluding high income)Europe & Central Asia (IDA & IBRD countries)European UnionFinlandFragile and conflict affected situationsFranceGabonGeorgiaGermanyGhanaGibraltarGreeceGuatemalaHaitiHeavily indebted poor countries (HIPC)High incomeHondurasHong Kong SAR, ChinaHungaryIBRD onlyIcelandIDA & IBRD totalIDA blendIDA onlyIDA totalIndiaIndonesiaIran, Islamic Rep.IraqIrelandIsraelItalyJamaicaJapanJordanKazakhstanKenyaKorea, Dem. People’s Rep.Korea, Rep.KosovoKuwaitKyrgyz RepublicLate-demographic dividendLatin America & Caribbean Latin America & Caribbean (excluding high income)Latin America & the Caribbean (IDA & IBRD countries)LatviaLeast developed countries: UN classificationLebanonLibyaLithuaniaLow & middle incomeLow incomeLower middle incomeLuxembourgMacedonia, FYRMalaysiaMaltaMauritiusMexicoMiddle East & North AfricaMiddle East & North Africa (excluding high income)Middle East & North Africa (IDA & IBRD countries)Middle incomeMoldovaMongoliaMontenegroMoroccoMozambiqueMyanmarNamibiaNepalNetherlandsNew ZealandNicaraguaNigerNigeriaNorth AmericaNorwayOECD membersOmanOther small statesPakistanPanamaParaguayPeruPhilippinesPolandPortugalPost-demographic dividendPre-demographic dividendQatarRomaniaRussian FederationSaudi ArabiaSenegalSerbiaSingaporeSlovak RepublicSloveniaSmall statesSouth AfricaSouth AsiaSouth Asia (IDA & IBRD)South SudanSpainSri LankaSub-Saharan Africa Sub-Saharan Africa (excluding high income)Sub-Saharan Africa (IDA & IBRD countries)SudanSwedenSwitzerlandSyrian Arab RepublicTajikistanTanzaniaThailandTogoTrinidad and TobagoTunisiaTurkeyTurkmenistanUkraineUnited Arab EmiratesUnited KingdomUnited StatesUpper middle incomeUruguayUzbekistanVenezuela, RBVietnamWorldYemen, Rep.ZambiaZimbabwe Timeline:
This timeline shows a graph from 1972 to 2014 of Bahrain. No data until 1971. Number of actual observations by date: 43.
Source name:
World Development Indicators
Source organization:
IEA Statistics © OECD/IEA 2014 (http://www.iea.org/stats/index.asp), subject to https://www.iea.org/t&c/termsandconditions/
Categories, topics:
Environment
Last updated:
apr 23, 2017
Indicators value changes by year
At the date of observation
Value
Absolute change
Change from previous value
jan 1, 1972
14.533
+14.533
0.0%
jan 1, 1973
16.364
+1.831
12.6%
jan 1, 1974
32.319
+15.955
97.5%
jan 1, 1975
40.99
+8.672
26.83%
jan 1, 1976
40.918
-0.072
-0.18%
jan 1, 1977
38.38
-2.538
-6.2%
jan 1, 1978
34.603
-3.777
-9.84%
jan 1, 1979
32.784
-1.819
-5.26%
jan 1, 1980
31.513
-1.272
-3.88%
jan 1, 1981
28.315
-3.198
-10.15%
jan 1, 1982
29.897
+1.582
5.59%
jan 1, 1983
32.555
+2.658
8.89%
jan 1, 1984
30.496
-2.059
-6.32%
jan 1, 1985
0.0
-30.496
-100.0%
jan 1, 1987
0.205
+0.205
%
jan 1, 1988
0.208
+0.003
1.56%
jan 1, 1989
0.198
-0.01
-4.94%
jan 1, 1990
0.292
+0.095
47.95%
jan 1, 1991
0.281
-0.011
-3.93%
jan 1, 1992
0.292
+0.011
3.89%
jan 1, 1993
0.246
-0.046
-15.6%
jan 1, 1994
0.231
-0.015
-6.09%
jan 1, 1995
0.226
-0.005
-2.33%
jan 1, 1996
0.297
+0.071
31.65%
jan 1, 1997
0.355
+0.057
19.32%
jan 1, 1998
0.488
+0.133
37.56%
jan 1, 1999
0.454
-0.034
-7.0%
jan 1, 2000
0.52
+0.066
14.51%
jan 1, 2001
0.505
-0.015
-2.84%
jan 1, 2002
0.795
+0.29
57.43%
jan 1, 2003
0.756
-0.039
-4.89%
jan 1, 2004
0.67
-0.086
-11.35%
jan 1, 2005
0.787
+0.117
17.45%
jan 1, 2006
0.827
+0.039
5.01%
jan 1, 2007
0.85
+0.023
2.81%
jan 1, 2008
0.919
+0.069
8.06%
jan 1, 2009
0.975
+0.057
6.16%
jan 1, 2010
1.167
+0.191
19.62%
jan 1, 2011
2.79
+1.623
139.14%
jan 1, 2012
3.078
+0.288
10.32%
jan 1, 2013
1.653
-1.424
-46.28%
jan 1, 2014
6.219
+4.566
276.18%
Ranking of countries by current statistics by years


Comments: