29
/
en
AIzaSyAYiBZKx7MnpbEhh9jyipgxe19OcubqV5w
April 1, 2024
207746
Netherlands
NLD
true
2
1
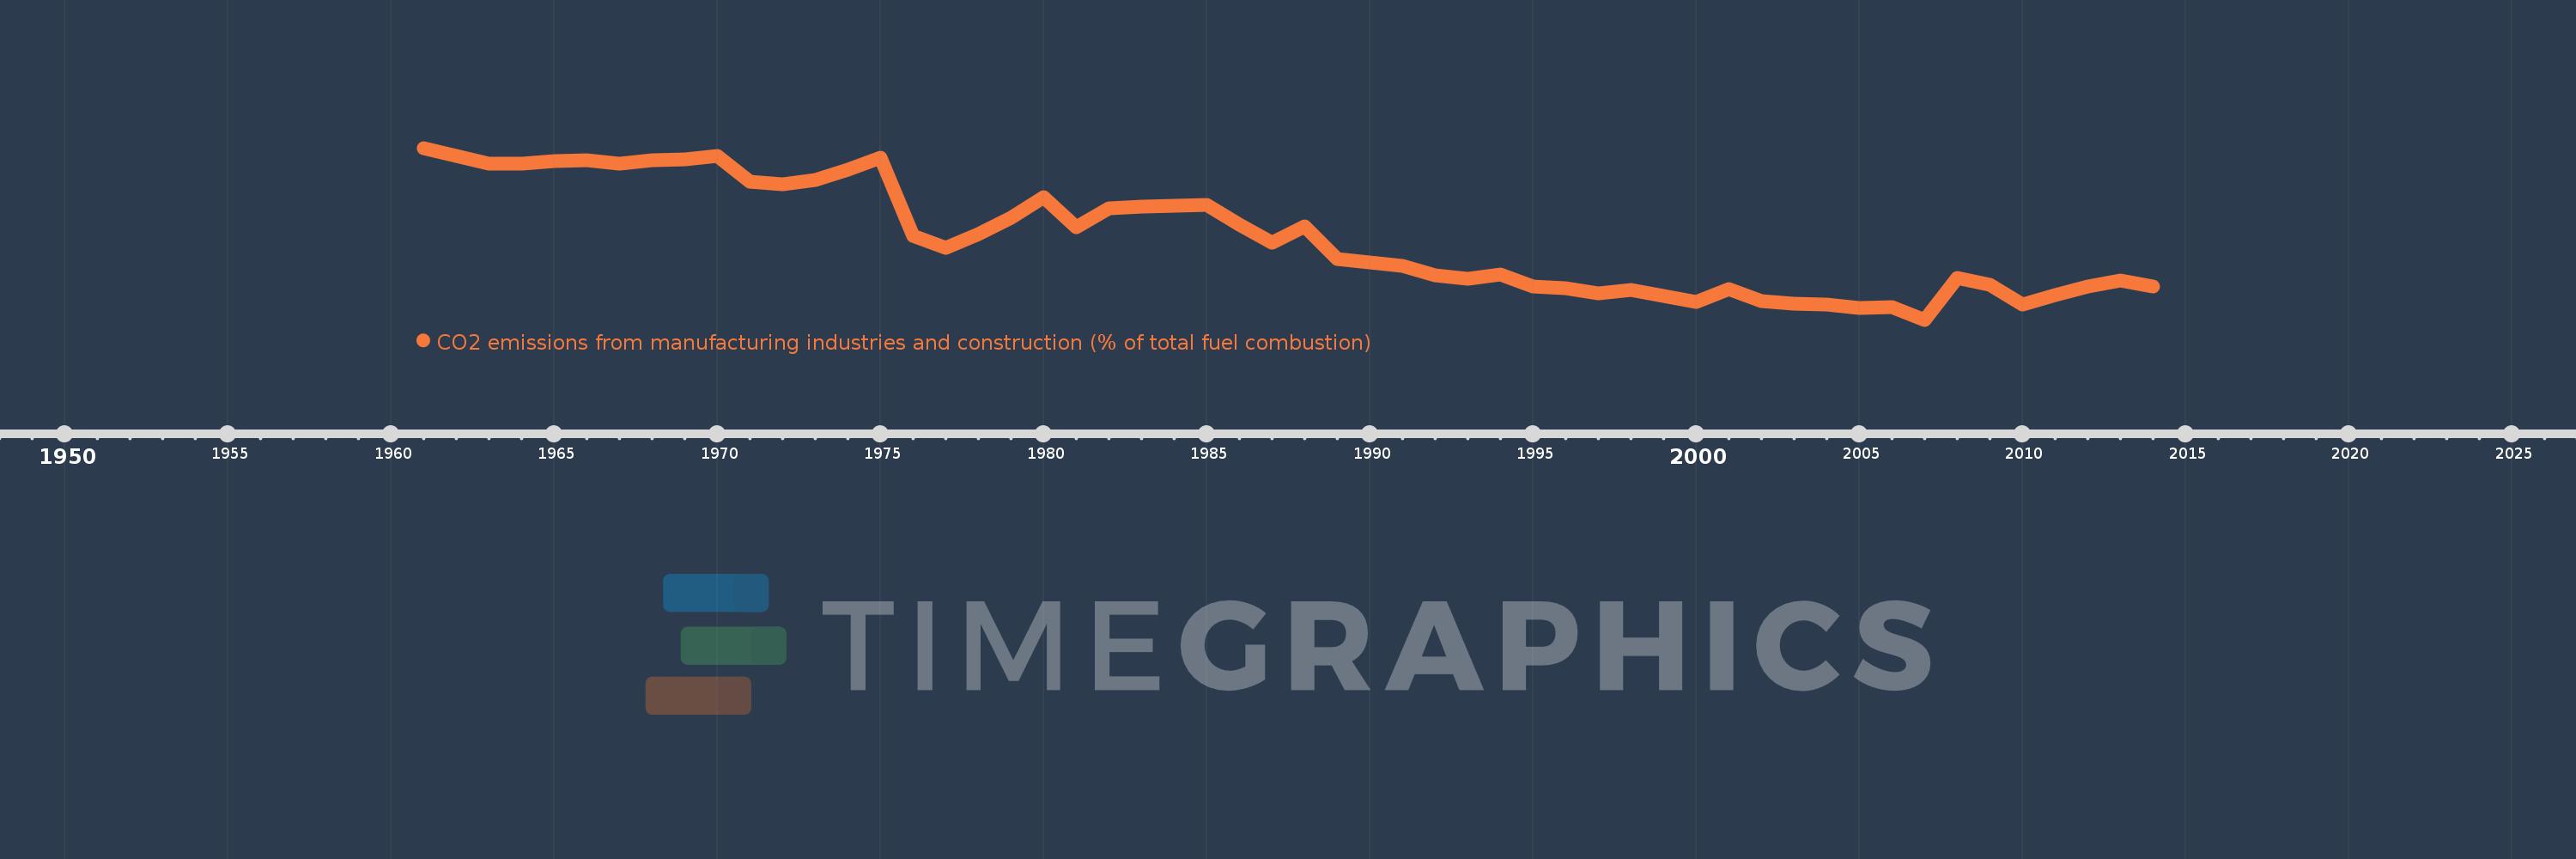
CO2 emissions from manufacturing industries and construction (% of total fuel combustion)
2014,2013,2012,2011,2010,2009,2008,2007,2006,2005,2004,2003,2002,2001,2000,1999,1998,1997,1996,1995,1994,1993,1992,1991,1990,1989,1988,1987,1986,1985,1984,1983,1982,1981,1980,1979,1978,1977,1976,1975,1974,1973,1972,1971,1970,1969,1968,1967,1966,1965,1964,1963,1962,1961
This statistics in other country:
AlbaniaAlgeriaAngolaArab WorldArgentinaArmeniaAustraliaAustriaAzerbaijanBahrainBangladeshBelarusBelgiumBeninBoliviaBosnia and HerzegovinaBotswanaBrazilBrunei DarussalamBulgariaCambodiaCameroonCanadaCaribbean small statesCentral Europe and the BalticsChileChinaColombiaCongo, Dem. Rep.Congo, Rep.Costa RicaCote d'IvoireCroatiaCubaCuracaoCyprusCzech RepublicDenmarkDominican RepublicEarly-demographic dividendEast Asia & PacificEast Asia & Pacific (excluding high income)East Asia & Pacific (IDA & IBRD countries)EcuadorEgypt, Arab Rep.El SalvadorEritreaEstoniaEthiopiaEuro areaEurope & Central AsiaEurope & Central Asia (excluding high income)Europe & Central Asia (IDA & IBRD countries)European UnionFinlandFragile and conflict affected situationsFranceGabonGeorgiaGermanyGhanaGibraltarGreeceGuatemalaHaitiHeavily indebted poor countries (HIPC)High incomeHondurasHong Kong SAR, ChinaHungaryIBRD onlyIcelandIDA & IBRD totalIDA blendIDA onlyIDA totalIndiaIndonesiaIran, Islamic Rep.IraqIrelandIsraelItalyJamaicaJapanJordanKazakhstanKenyaKorea, Dem. People’s Rep.Korea, Rep.KosovoKuwaitKyrgyz RepublicLate-demographic dividendLatin America & Caribbean Latin America & Caribbean (excluding high income)Latin America & the Caribbean (IDA & IBRD countries)LatviaLeast developed countries: UN classificationLebanonLibyaLithuaniaLow & middle incomeLow incomeLower middle incomeLuxembourgMacedonia, FYRMalaysiaMaltaMauritiusMexicoMiddle East & North AfricaMiddle East & North Africa (excluding high income)Middle East & North Africa (IDA & IBRD countries)Middle incomeMoldovaMongoliaMontenegroMoroccoMozambiqueMyanmarNamibiaNepalNetherlandsNew ZealandNicaraguaNigerNigeriaNorth AmericaNorwayOECD membersOmanOther small statesPakistanPanamaParaguayPeruPhilippinesPolandPortugalPost-demographic dividendPre-demographic dividendQatarRomaniaRussian FederationSaudi ArabiaSenegalSerbiaSingaporeSlovak RepublicSloveniaSmall statesSouth AfricaSouth AsiaSouth Asia (IDA & IBRD)South SudanSpainSri LankaSub-Saharan Africa Sub-Saharan Africa (excluding high income)Sub-Saharan Africa (IDA & IBRD countries)SudanSwedenSwitzerlandSyrian Arab RepublicTajikistanTanzaniaThailandTogoTrinidad and TobagoTunisiaTurkeyTurkmenistanUkraineUnited Arab EmiratesUnited KingdomUnited StatesUpper middle incomeUruguayUzbekistanVenezuela, RBVietnamWorldYemen, Rep.ZambiaZimbabwe Timeline:
This timeline shows a graph from 1961 to 2014 of Netherlands. No data until 1960. Number of actual observations by date: 54.
Source name:
World Development Indicators
Source organization:
IEA Statistics © OECD/IEA 2014 (http://www.iea.org/stats/index.asp), subject to https://www.iea.org/t&c/termsandconditions/
Categories, topics:
Environment
Last updated:
apr 23, 2017
Indicators value changes by year
Minimum:
12.187
jan 1, 2007
At the date of observation
Value
Absolute change
Change from previous value
jan 1, 1961
24.34
+24.34
0.0%
jan 1, 1962
23.783
-0.557
-2.29%
jan 1, 1963
23.249
-0.534
-2.24%
jan 1, 1964
23.239
-0.01
-0.04%
jan 1, 1965
23.432
+0.192
0.83%
jan 1, 1966
23.453
+0.022
0.09%
jan 1, 1967
23.228
-0.225
-0.96%
jan 1, 1968
23.48
+0.252
1.08%
jan 1, 1969
23.502
+0.022
0.09%
jan 1, 1970
23.786
+0.284
1.21%
jan 1, 1971
21.953
-1.833
-7.71%
jan 1, 1972
21.79
-0.163
-0.74%
jan 1, 1973
22.044
+0.255
1.17%
jan 1, 1974
22.785
+0.74
3.36%
jan 1, 1975
23.649
+0.865
3.79%
jan 1, 1976
18.134
-5.516
-23.32%
jan 1, 1977
17.274
-0.859
-4.74%
jan 1, 1978
18.264
+0.989
5.73%
jan 1, 1979
19.39
+1.126
6.17%
jan 1, 1980
20.888
+1.498
7.73%
jan 1, 1981
18.74
-2.149
-10.29%
jan 1, 1982
20.081
+1.341
7.16%
jan 1, 1983
20.212
+0.131
0.65%
jan 1, 1984
20.248
+0.036
0.18%
jan 1, 1985
20.324
+0.075
0.37%
jan 1, 1986
18.93
-1.394
-6.86%
jan 1, 1987
17.651
-1.279
-6.76%
jan 1, 1988
18.779
+1.128
6.39%
jan 1, 1989
16.477
-2.302
-12.26%
jan 1, 1990
16.22
-0.257
-1.56%
jan 1, 1991
15.996
-0.224
-1.38%
jan 1, 1992
15.341
-0.655
-4.09%
jan 1, 1993
15.089
-0.252
-1.64%
jan 1, 1994
15.383
+0.294
1.95%
jan 1, 1995
14.546
-0.836
-5.44%
jan 1, 1996
14.391
-0.155
-1.07%
jan 1, 1997
14.071
-0.32
-2.22%
jan 1, 1998
14.268
+0.196
1.4%
jan 1, 1999
13.854
-0.414
-2.9%
jan 1, 2000
13.417
-0.437
-3.16%
jan 1, 2001
14.327
+0.91
6.78%
jan 1, 2002
13.527
-0.8
-5.58%
jan 1, 2003
13.304
-0.223
-1.65%
jan 1, 2004
13.28
-0.024
-0.18%
jan 1, 2005
13.032
-0.248
-1.87%
jan 1, 2006
13.084
+0.052
0.4%
jan 1, 2007
12.187
-0.897
-6.85%
jan 1, 2008
15.155
+2.967
24.35%
jan 1, 2009
14.668
-0.486
-3.21%
jan 1, 2010
13.236
-1.432
-9.76%
jan 1, 2011
13.955
+0.719
5.43%
jan 1, 2012
14.542
+0.587
4.2%
jan 1, 2013
14.939
+0.397
2.73%
jan 1, 2014
14.523
-0.415
-2.78%
Ranking of countries by current statistics by years


Comments: