29
/
en
AIzaSyAYiBZKx7MnpbEhh9jyipgxe19OcubqV5w
April 1, 2024
27131
East Asia & Pacific
EAS
false
2
1
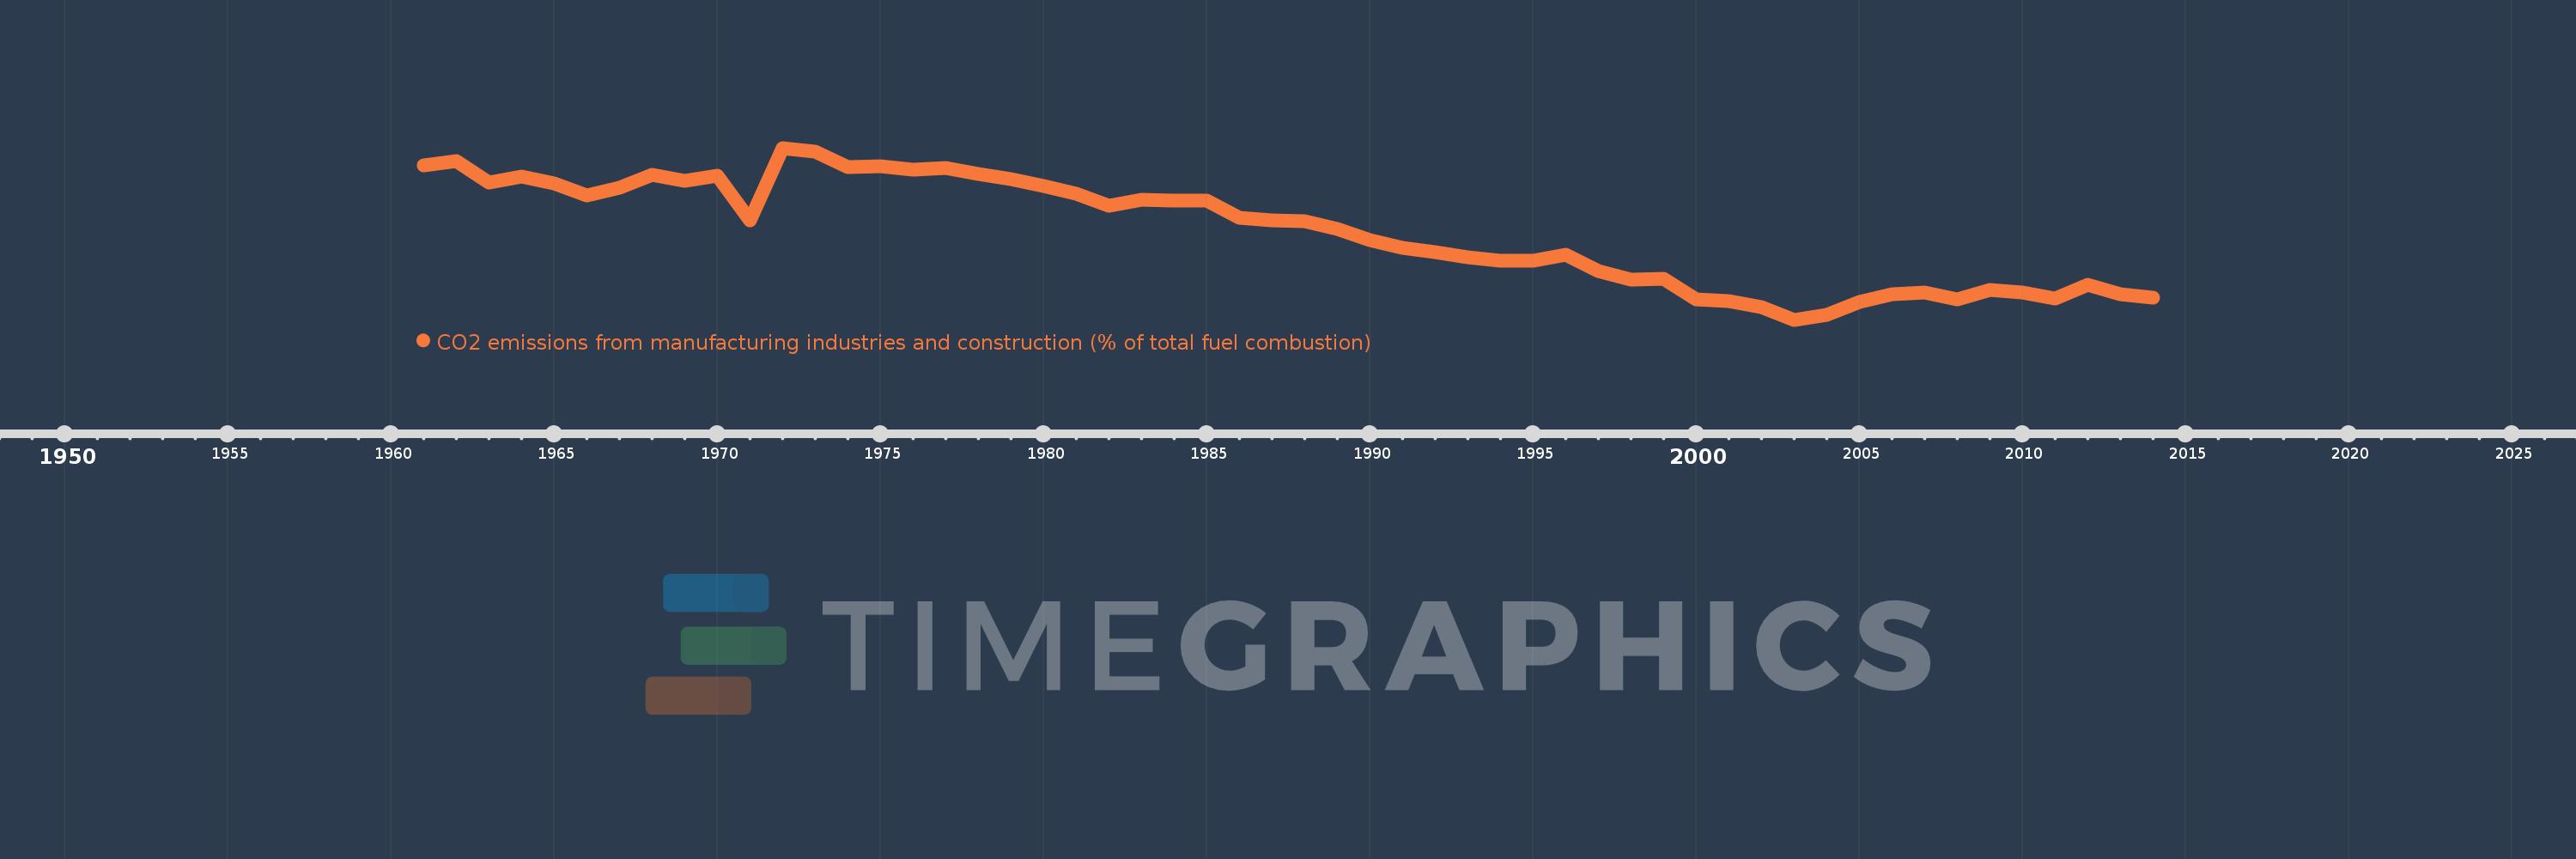
CO2 emissions from manufacturing industries and construction (% of total fuel combustion)
2014,2013,2012,2011,2010,2009,2008,2007,2006,2005,2004,2003,2002,2001,2000,1999,1998,1997,1996,1995,1994,1993,1992,1991,1990,1989,1988,1987,1986,1985,1984,1983,1982,1981,1980,1979,1978,1977,1976,1975,1974,1973,1972,1971,1970,1969,1968,1967,1966,1965,1964,1963,1962,1961
This statistics in other country:
AlbaniaAlgeriaAngolaArab WorldArgentinaArmeniaAustraliaAustriaAzerbaijanBahrainBangladeshBelarusBelgiumBeninBoliviaBosnia and HerzegovinaBotswanaBrazilBrunei DarussalamBulgariaCambodiaCameroonCanadaCaribbean small statesCentral Europe and the BalticsChileChinaColombiaCongo, Dem. Rep.Congo, Rep.Costa RicaCote d'IvoireCroatiaCubaCuracaoCyprusCzech RepublicDenmarkDominican RepublicEarly-demographic dividendEast Asia & PacificEast Asia & Pacific (excluding high income)East Asia & Pacific (IDA & IBRD countries)EcuadorEgypt, Arab Rep.El SalvadorEritreaEstoniaEthiopiaEuro areaEurope & Central AsiaEurope & Central Asia (excluding high income)Europe & Central Asia (IDA & IBRD countries)European UnionFinlandFragile and conflict affected situationsFranceGabonGeorgiaGermanyGhanaGibraltarGreeceGuatemalaHaitiHeavily indebted poor countries (HIPC)High incomeHondurasHong Kong SAR, ChinaHungaryIBRD onlyIcelandIDA & IBRD totalIDA blendIDA onlyIDA totalIndiaIndonesiaIran, Islamic Rep.IraqIrelandIsraelItalyJamaicaJapanJordanKazakhstanKenyaKorea, Dem. People’s Rep.Korea, Rep.KosovoKuwaitKyrgyz RepublicLate-demographic dividendLatin America & Caribbean Latin America & Caribbean (excluding high income)Latin America & the Caribbean (IDA & IBRD countries)LatviaLeast developed countries: UN classificationLebanonLibyaLithuaniaLow & middle incomeLow incomeLower middle incomeLuxembourgMacedonia, FYRMalaysiaMaltaMauritiusMexicoMiddle East & North AfricaMiddle East & North Africa (excluding high income)Middle East & North Africa (IDA & IBRD countries)Middle incomeMoldovaMongoliaMontenegroMoroccoMozambiqueMyanmarNamibiaNepalNetherlandsNew ZealandNicaraguaNigerNigeriaNorth AmericaNorwayOECD membersOmanOther small statesPakistanPanamaParaguayPeruPhilippinesPolandPortugalPost-demographic dividendPre-demographic dividendQatarRomaniaRussian FederationSaudi ArabiaSenegalSerbiaSingaporeSlovak RepublicSloveniaSmall statesSouth AfricaSouth AsiaSouth Asia (IDA & IBRD)South SudanSpainSri LankaSub-Saharan Africa Sub-Saharan Africa (excluding high income)Sub-Saharan Africa (IDA & IBRD countries)SudanSwedenSwitzerlandSyrian Arab RepublicTajikistanTanzaniaThailandTogoTrinidad and TobagoTunisiaTurkeyTurkmenistanUkraineUnited Arab EmiratesUnited KingdomUnited StatesUpper middle incomeUruguayUzbekistanVenezuela, RBVietnamWorldYemen, Rep.ZambiaZimbabwe Timeline:
This timeline shows a graph from 1961 to 2014 of East Asia & Pacific. No data until 1960. Number of actual observations by date: 54.
Source name:
World Development Indicators
Source organization:
IEA Statistics © OECD/IEA 2014 (http://www.iea.org/stats/index.asp), subject to https://www.iea.org/t&c/termsandconditions/
Categories, topics:
Environment
Last updated:
apr 23, 2017
Indicators value changes by year
Minimum:
24.983
jan 1, 2003
Maximum:
42.108
jan 1, 1972
At the date of observation
Value
Absolute change
Change from previous value
jan 1, 1961
40.333
+40.333
0.0%
jan 1, 1962
40.761
+0.427
1.06%
jan 1, 1963
38.691
-2.069
-5.08%
jan 1, 1964
39.228
+0.536
1.39%
jan 1, 1965
38.562
-0.665
-1.7%
jan 1, 1966
37.366
-1.196
-3.1%
jan 1, 1967
38.171
+0.805
2.15%
jan 1, 1968
39.403
+1.232
3.23%
jan 1, 1969
38.824
-0.579
-1.47%
jan 1, 1970
39.362
+0.538
1.39%
jan 1, 1971
34.909
-4.453
-11.31%
jan 1, 1972
42.108
+7.199
20.62%
jan 1, 1973
41.719
-0.389
-0.92%
jan 1, 1974
40.236
-1.483
-3.55%
jan 1, 1975
40.272
+0.036
0.09%
jan 1, 1976
39.967
-0.306
-0.76%
jan 1, 1977
40.125
+0.159
0.4%
jan 1, 1978
39.512
-0.613
-1.53%
jan 1, 1979
38.965
-0.547
-1.39%
jan 1, 1980
38.33
-0.635
-1.63%
jan 1, 1981
37.57
-0.76
-1.98%
jan 1, 1982
36.356
-1.214
-3.23%
jan 1, 1983
36.984
+0.628
1.73%
jan 1, 1984
36.824
-0.16
-0.43%
jan 1, 1985
36.847
+0.023
0.06%
jan 1, 1986
35.139
-1.709
-4.64%
jan 1, 1987
34.909
-0.23
-0.65%
jan 1, 1988
34.794
-0.115
-0.33%
jan 1, 1989
34.027
-0.767
-2.2%
jan 1, 1990
32.946
-1.081
-3.18%
jan 1, 1991
32.176
-0.77
-2.34%
jan 1, 1992
31.695
-0.481
-1.5%
jan 1, 1993
31.218
-0.478
-1.51%
jan 1, 1994
30.873
-0.344
-1.1%
jan 1, 1995
30.835
-0.038
-0.12%
jan 1, 1996
31.498
+0.663
2.15%
jan 1, 1997
29.826
-1.673
-5.31%
jan 1, 1998
28.975
-0.85
-2.85%
jan 1, 1999
29.074
+0.099
0.34%
jan 1, 2000
26.99
-2.084
-7.17%
jan 1, 2001
26.845
-0.145
-0.54%
jan 1, 2002
26.246
-0.599
-2.23%
jan 1, 2003
24.983
-1.262
-4.81%
jan 1, 2004
25.446
+0.463
1.85%
jan 1, 2005
26.714
+1.268
4.98%
jan 1, 2006
27.532
+0.818
3.06%
jan 1, 2007
27.691
+0.159
0.58%
jan 1, 2008
27.046
-0.645
-2.33%
jan 1, 2009
27.949
+0.903
3.34%
jan 1, 2010
27.73
-0.219
-0.79%
jan 1, 2011
27.095
-0.635
-2.29%
jan 1, 2012
28.496
+1.401
5.17%
jan 1, 2013
27.543
-0.953
-3.34%
jan 1, 2014
27.216
-0.327
-1.19%
Ranking of countries by current statistics by years


Comments: