29
/
en
AIzaSyAYiBZKx7MnpbEhh9jyipgxe19OcubqV5w
April 1, 2024
201338
Morocco
MAR
true
2
1
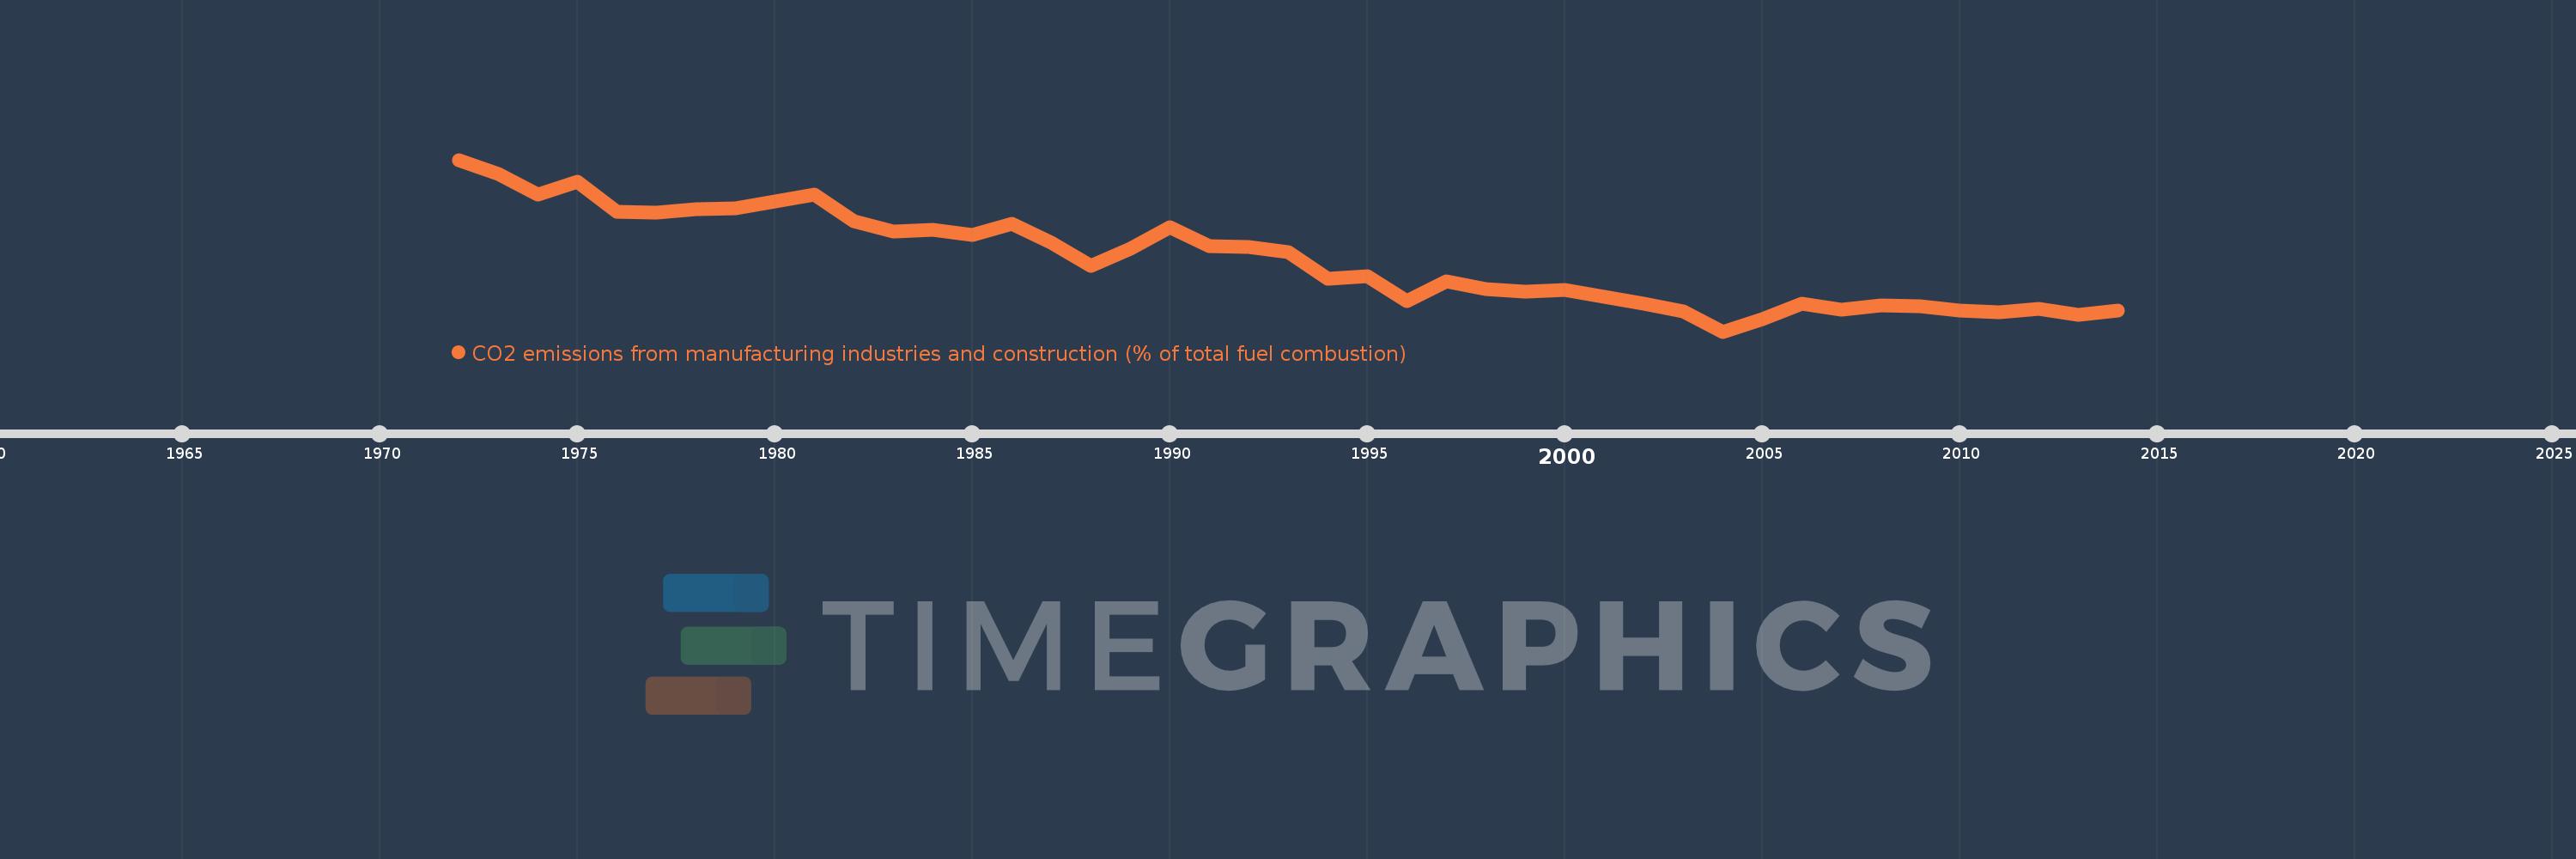
CO2 emissions from manufacturing industries and construction (% of total fuel combustion)
2014,2013,2012,2011,2010,2009,2008,2007,2006,2005,2004,2003,2002,2001,2000,1999,1998,1997,1996,1995,1994,1993,1992,1991,1990,1989,1988,1987,1986,1985,1984,1983,1982,1981,1980,1979,1978,1977,1976,1975,1974,1973,1972
This statistics in other country:
AlbaniaAlgeriaAngolaArab WorldArgentinaArmeniaAustraliaAustriaAzerbaijanBahrainBangladeshBelarusBelgiumBeninBoliviaBosnia and HerzegovinaBotswanaBrazilBrunei DarussalamBulgariaCambodiaCameroonCanadaCaribbean small statesCentral Europe and the BalticsChileChinaColombiaCongo, Dem. Rep.Congo, Rep.Costa RicaCote d'IvoireCroatiaCubaCuracaoCyprusCzech RepublicDenmarkDominican RepublicEarly-demographic dividendEast Asia & PacificEast Asia & Pacific (excluding high income)East Asia & Pacific (IDA & IBRD countries)EcuadorEgypt, Arab Rep.El SalvadorEritreaEstoniaEthiopiaEuro areaEurope & Central AsiaEurope & Central Asia (excluding high income)Europe & Central Asia (IDA & IBRD countries)European UnionFinlandFragile and conflict affected situationsFranceGabonGeorgiaGermanyGhanaGibraltarGreeceGuatemalaHaitiHeavily indebted poor countries (HIPC)High incomeHondurasHong Kong SAR, ChinaHungaryIBRD onlyIcelandIDA & IBRD totalIDA blendIDA onlyIDA totalIndiaIndonesiaIran, Islamic Rep.IraqIrelandIsraelItalyJamaicaJapanJordanKazakhstanKenyaKorea, Dem. People’s Rep.Korea, Rep.KosovoKuwaitKyrgyz RepublicLate-demographic dividendLatin America & Caribbean Latin America & Caribbean (excluding high income)Latin America & the Caribbean (IDA & IBRD countries)LatviaLeast developed countries: UN classificationLebanonLibyaLithuaniaLow & middle incomeLow incomeLower middle incomeLuxembourgMacedonia, FYRMalaysiaMaltaMauritiusMexicoMiddle East & North AfricaMiddle East & North Africa (excluding high income)Middle East & North Africa (IDA & IBRD countries)Middle incomeMoldovaMongoliaMontenegroMoroccoMozambiqueMyanmarNamibiaNepalNetherlandsNew ZealandNicaraguaNigerNigeriaNorth AmericaNorwayOECD membersOmanOther small statesPakistanPanamaParaguayPeruPhilippinesPolandPortugalPost-demographic dividendPre-demographic dividendQatarRomaniaRussian FederationSaudi ArabiaSenegalSerbiaSingaporeSlovak RepublicSloveniaSmall statesSouth AfricaSouth AsiaSouth Asia (IDA & IBRD)South SudanSpainSri LankaSub-Saharan Africa Sub-Saharan Africa (excluding high income)Sub-Saharan Africa (IDA & IBRD countries)SudanSwedenSwitzerlandSyrian Arab RepublicTajikistanTanzaniaThailandTogoTrinidad and TobagoTunisiaTurkeyTurkmenistanUkraineUnited Arab EmiratesUnited KingdomUnited StatesUpper middle incomeUruguayUzbekistanVenezuela, RBVietnamWorldYemen, Rep.ZambiaZimbabwe Timeline:
This timeline shows a graph from 1972 to 2014 of Morocco. No data until 1971. Number of actual observations by date: 43.
Source name:
World Development Indicators
Source organization:
IEA Statistics © OECD/IEA 2014 (http://www.iea.org/stats/index.asp), subject to https://www.iea.org/t&c/termsandconditions/
Categories, topics:
Environment
Last updated:
apr 23, 2017
Indicators value changes by year
Minimum:
11.464
jan 1, 2004
Maximum:
41.793
jan 1, 1972
At the date of observation
Value
Absolute change
Change from previous value
jan 1, 1972
41.793
+41.793
0.0%
jan 1, 1973
39.281
-2.513
-6.01%
jan 1, 1974
35.654
-3.627
-9.23%
jan 1, 1975
37.912
+2.258
6.33%
jan 1, 1976
32.609
-5.303
-13.99%
jan 1, 1977
32.516
-0.092
-0.28%
jan 1, 1978
33.076
+0.559
1.72%
jan 1, 1979
33.199
+0.124
0.37%
jan 1, 1980
34.434
+1.234
3.72%
jan 1, 1981
35.599
+1.166
3.39%
jan 1, 1982
30.952
-4.647
-13.05%
jan 1, 1983
29.152
-1.8
-5.82%
jan 1, 1984
29.431
+0.279
0.96%
jan 1, 1985
28.599
-0.832
-2.83%
jan 1, 1986
30.424
+1.825
6.38%
jan 1, 1987
27.104
-3.32
-10.91%
jan 1, 1988
23.135
-3.969
-14.64%
jan 1, 1989
26.058
+2.923
12.63%
jan 1, 1990
29.83
+3.772
14.48%
jan 1, 1991
26.565
-3.265
-10.95%
jan 1, 1992
26.456
-0.109
-0.41%
jan 1, 1993
25.441
-1.016
-3.84%
jan 1, 1994
20.797
-4.644
-18.25%
jan 1, 1995
21.208
+0.412
1.98%
jan 1, 1996
16.801
-4.408
-20.78%
jan 1, 1997
20.35
+3.549
21.13%
jan 1, 1998
18.95
-1.4
-6.88%
jan 1, 1999
18.519
-0.432
-2.28%
jan 1, 2000
18.776
+0.257
1.39%
jan 1, 2001
17.671
-1.105
-5.88%
jan 1, 2002
16.34
-1.33
-7.53%
jan 1, 2003
15.032
-1.309
-8.01%
jan 1, 2004
11.464
-3.567
-23.73%
jan 1, 2005
13.728
+2.264
19.75%
jan 1, 2006
16.333
+2.606
18.98%
jan 1, 2007
15.36
-0.974
-5.96%
jan 1, 2008
16.156
+0.797
5.19%
jan 1, 2009
15.928
-0.228
-1.41%
jan 1, 2010
15.145
-0.783
-4.91%
jan 1, 2011
14.941
-0.204
-1.35%
jan 1, 2012
15.497
+0.555
3.72%
jan 1, 2013
14.377
-1.119
-7.22%
jan 1, 2014
15.117
+0.74
5.15%
Ranking of countries by current statistics by years


Comments: