29
/
en
AIzaSyAYiBZKx7MnpbEhh9jyipgxe19OcubqV5w
April 1, 2024
266647
Trinidad and Tobago
TTO
true
2
1
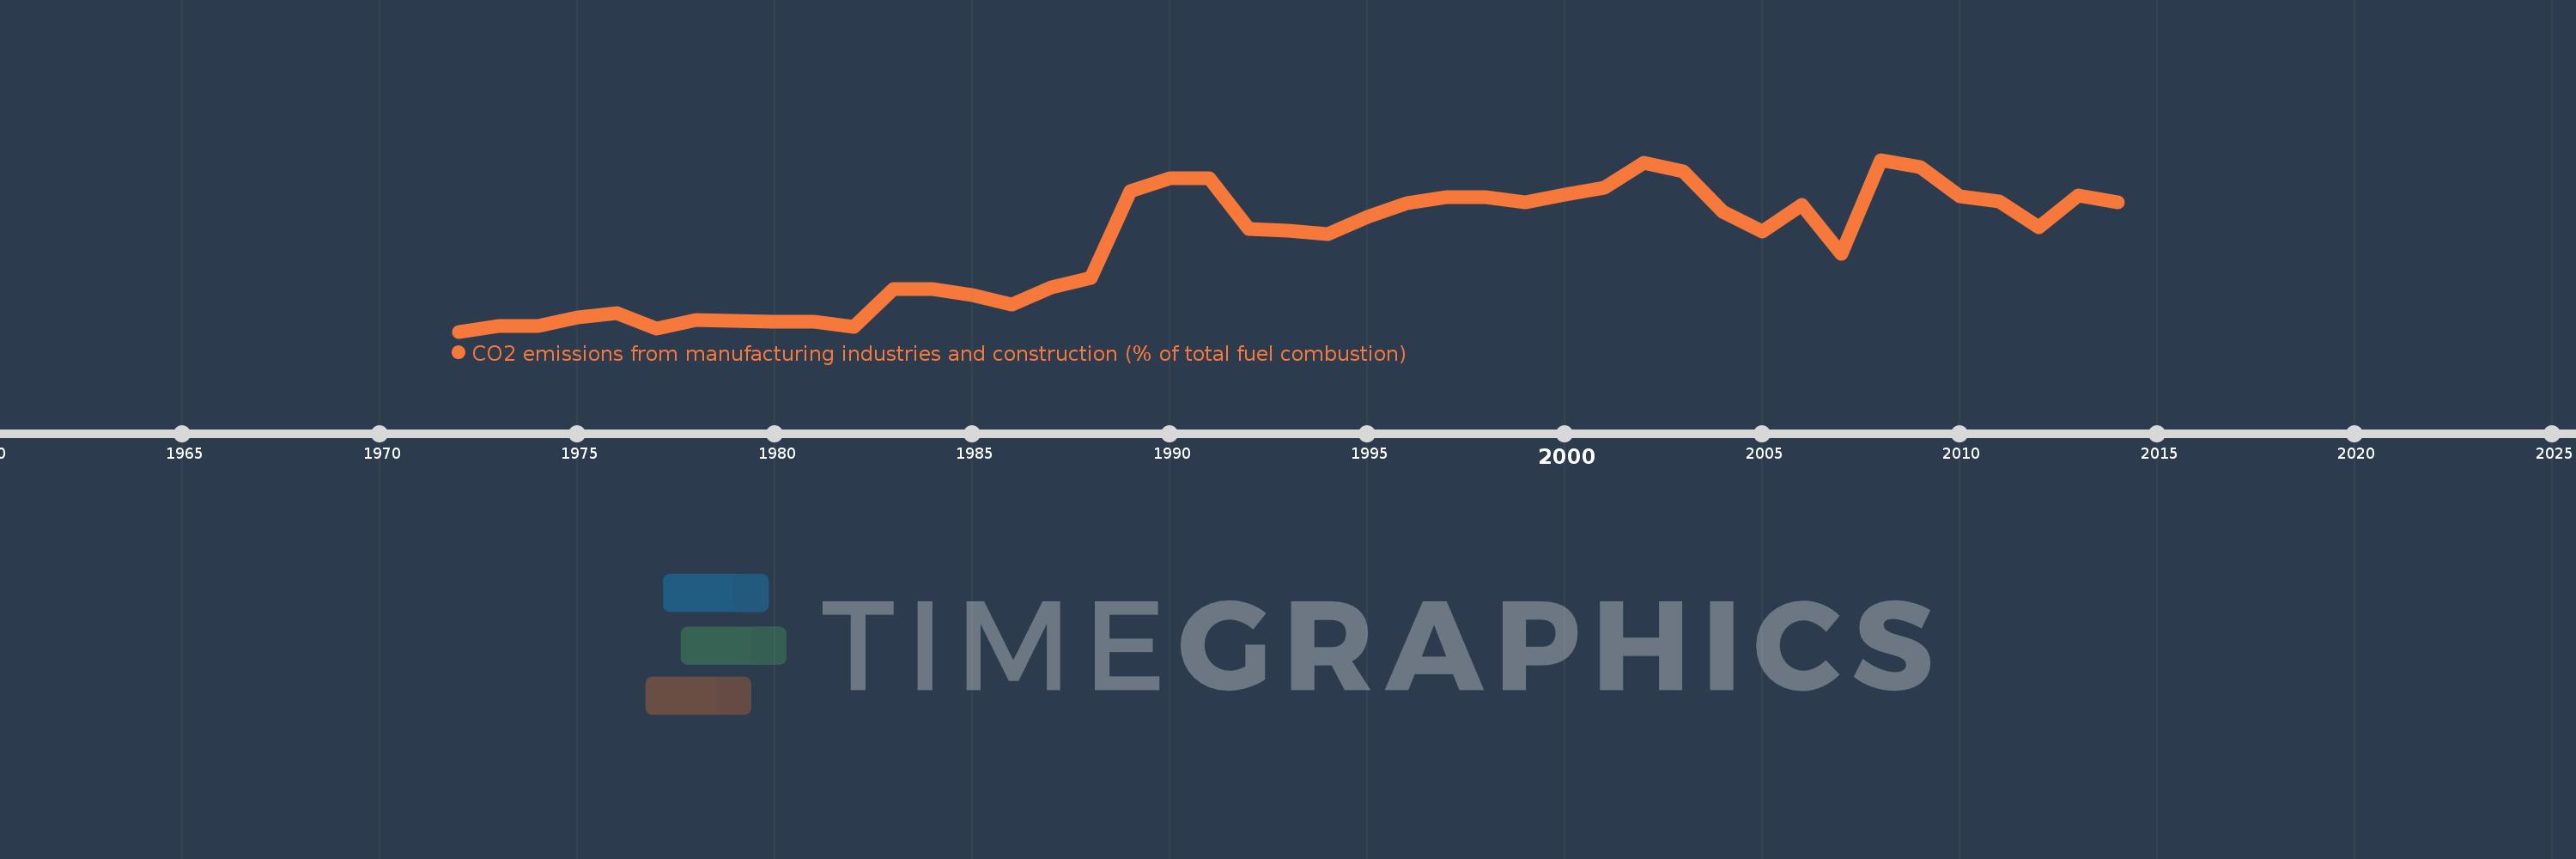
CO2 emissions from manufacturing industries and construction (% of total fuel combustion)
2014,2013,2012,2011,2010,2009,2008,2007,2006,2005,2004,2003,2002,2001,2000,1999,1998,1997,1996,1995,1994,1993,1992,1991,1990,1989,1988,1987,1986,1985,1984,1983,1982,1981,1980,1979,1978,1977,1976,1975,1974,1973,1972
This statistics in other country:
AlbaniaAlgeriaAngolaArab WorldArgentinaArmeniaAustraliaAustriaAzerbaijanBahrainBangladeshBelarusBelgiumBeninBoliviaBosnia and HerzegovinaBotswanaBrazilBrunei DarussalamBulgariaCambodiaCameroonCanadaCaribbean small statesCentral Europe and the BalticsChileChinaColombiaCongo, Dem. Rep.Congo, Rep.Costa RicaCote d'IvoireCroatiaCubaCuracaoCyprusCzech RepublicDenmarkDominican RepublicEarly-demographic dividendEast Asia & PacificEast Asia & Pacific (excluding high income)East Asia & Pacific (IDA & IBRD countries)EcuadorEgypt, Arab Rep.El SalvadorEritreaEstoniaEthiopiaEuro areaEurope & Central AsiaEurope & Central Asia (excluding high income)Europe & Central Asia (IDA & IBRD countries)European UnionFinlandFragile and conflict affected situationsFranceGabonGeorgiaGermanyGhanaGibraltarGreeceGuatemalaHaitiHeavily indebted poor countries (HIPC)High incomeHondurasHong Kong SAR, ChinaHungaryIBRD onlyIcelandIDA & IBRD totalIDA blendIDA onlyIDA totalIndiaIndonesiaIran, Islamic Rep.IraqIrelandIsraelItalyJamaicaJapanJordanKazakhstanKenyaKorea, Dem. People’s Rep.Korea, Rep.KosovoKuwaitKyrgyz RepublicLate-demographic dividendLatin America & Caribbean Latin America & Caribbean (excluding high income)Latin America & the Caribbean (IDA & IBRD countries)LatviaLeast developed countries: UN classificationLebanonLibyaLithuaniaLow & middle incomeLow incomeLower middle incomeLuxembourgMacedonia, FYRMalaysiaMaltaMauritiusMexicoMiddle East & North AfricaMiddle East & North Africa (excluding high income)Middle East & North Africa (IDA & IBRD countries)Middle incomeMoldovaMongoliaMontenegroMoroccoMozambiqueMyanmarNamibiaNepalNetherlandsNew ZealandNicaraguaNigerNigeriaNorth AmericaNorwayOECD membersOmanOther small statesPakistanPanamaParaguayPeruPhilippinesPolandPortugalPost-demographic dividendPre-demographic dividendQatarRomaniaRussian FederationSaudi ArabiaSenegalSerbiaSingaporeSlovak RepublicSloveniaSmall statesSouth AfricaSouth AsiaSouth Asia (IDA & IBRD)South SudanSpainSri LankaSub-Saharan Africa Sub-Saharan Africa (excluding high income)Sub-Saharan Africa (IDA & IBRD countries)SudanSwedenSwitzerlandSyrian Arab RepublicTajikistanTanzaniaThailandTogoTrinidad and TobagoTunisiaTurkeyTurkmenistanUkraineUnited Arab EmiratesUnited KingdomUnited StatesUpper middle incomeUruguayUzbekistanVenezuela, RBVietnamWorldYemen, Rep.ZambiaZimbabwe Timeline:
This timeline shows a graph from 1972 to 2014 of Trinidad and Tobago. No data until 1971. Number of actual observations by date: 43.
Source name:
World Development Indicators
Source organization:
IEA Statistics © OECD/IEA 2014 (http://www.iea.org/stats/index.asp), subject to https://www.iea.org/t&c/termsandconditions/
Categories, topics:
Environment
Last updated:
apr 23, 2017
Indicators value changes by year
Maximum:
23.788
jan 1, 2008
At the date of observation
Value
Absolute change
Change from previous value
jan 1, 1972
3.724
+3.724
0.0%
jan 1, 1973
4.388
+0.663
17.81%
jan 1, 1974
4.409
+0.022
0.49%
jan 1, 1975
5.395
+0.986
22.36%
jan 1, 1976
5.908
+0.513
9.51%
jan 1, 1977
4.054
-1.854
-31.38%
jan 1, 1978
5.051
+0.996
24.58%
jan 1, 1979
4.932
-0.119
-2.35%
jan 1, 1980
4.899
-0.033
-0.68%
jan 1, 1981
4.867
-0.032
-0.66%
jan 1, 1982
4.306
-0.561
-11.53%
jan 1, 1983
8.689
+4.384
101.82%
jan 1, 1984
8.735
+0.045
0.52%
jan 1, 1985
8.0
-0.735
-8.41%
jan 1, 1986
6.917
-1.083
-13.53%
jan 1, 1987
8.931
+2.014
29.11%
jan 1, 1988
10.028
+1.097
12.28%
jan 1, 1989
20.078
+10.05
100.22%
jan 1, 1990
21.607
+1.53
7.62%
jan 1, 1991
21.646
+0.038
0.18%
jan 1, 1992
15.749
-5.897
-27.24%
jan 1, 1993
15.545
-0.204
-1.3%
jan 1, 1994
15.121
-0.424
-2.73%
jan 1, 1995
17.122
+2.001
13.23%
jan 1, 1996
18.75
+1.628
9.51%
jan 1, 1997
19.435
+0.685
3.65%
jan 1, 1998
19.429
-0.005
-0.03%
jan 1, 1999
18.776
-0.653
-3.36%
jan 1, 2000
19.726
+0.949
5.06%
jan 1, 2001
20.495
+0.769
3.9%
jan 1, 2002
23.449
+2.954
14.42%
jan 1, 2003
22.435
-1.015
-4.33%
jan 1, 2004
17.766
-4.669
-20.81%
jan 1, 2005
15.365
-2.401
-13.51%
jan 1, 2006
18.472
+3.107
20.22%
jan 1, 2007
12.757
-5.715
-30.94%
jan 1, 2008
23.788
+11.03
86.46%
jan 1, 2009
22.945
-0.843
-3.54%
jan 1, 2010
19.484
-3.46
-15.08%
jan 1, 2011
18.935
-0.55
-2.82%
jan 1, 2012
15.872
-3.062
-16.17%
jan 1, 2013
19.646
+3.774
23.78%
jan 1, 2014
18.824
-0.823
-4.19%
Ranking of countries by current statistics by years


Comments: