29
/
en
AIzaSyAYiBZKx7MnpbEhh9jyipgxe19OcubqV5w
April 1, 2024
34096
Fragile and conflict affected situations
FCS
false
2
1
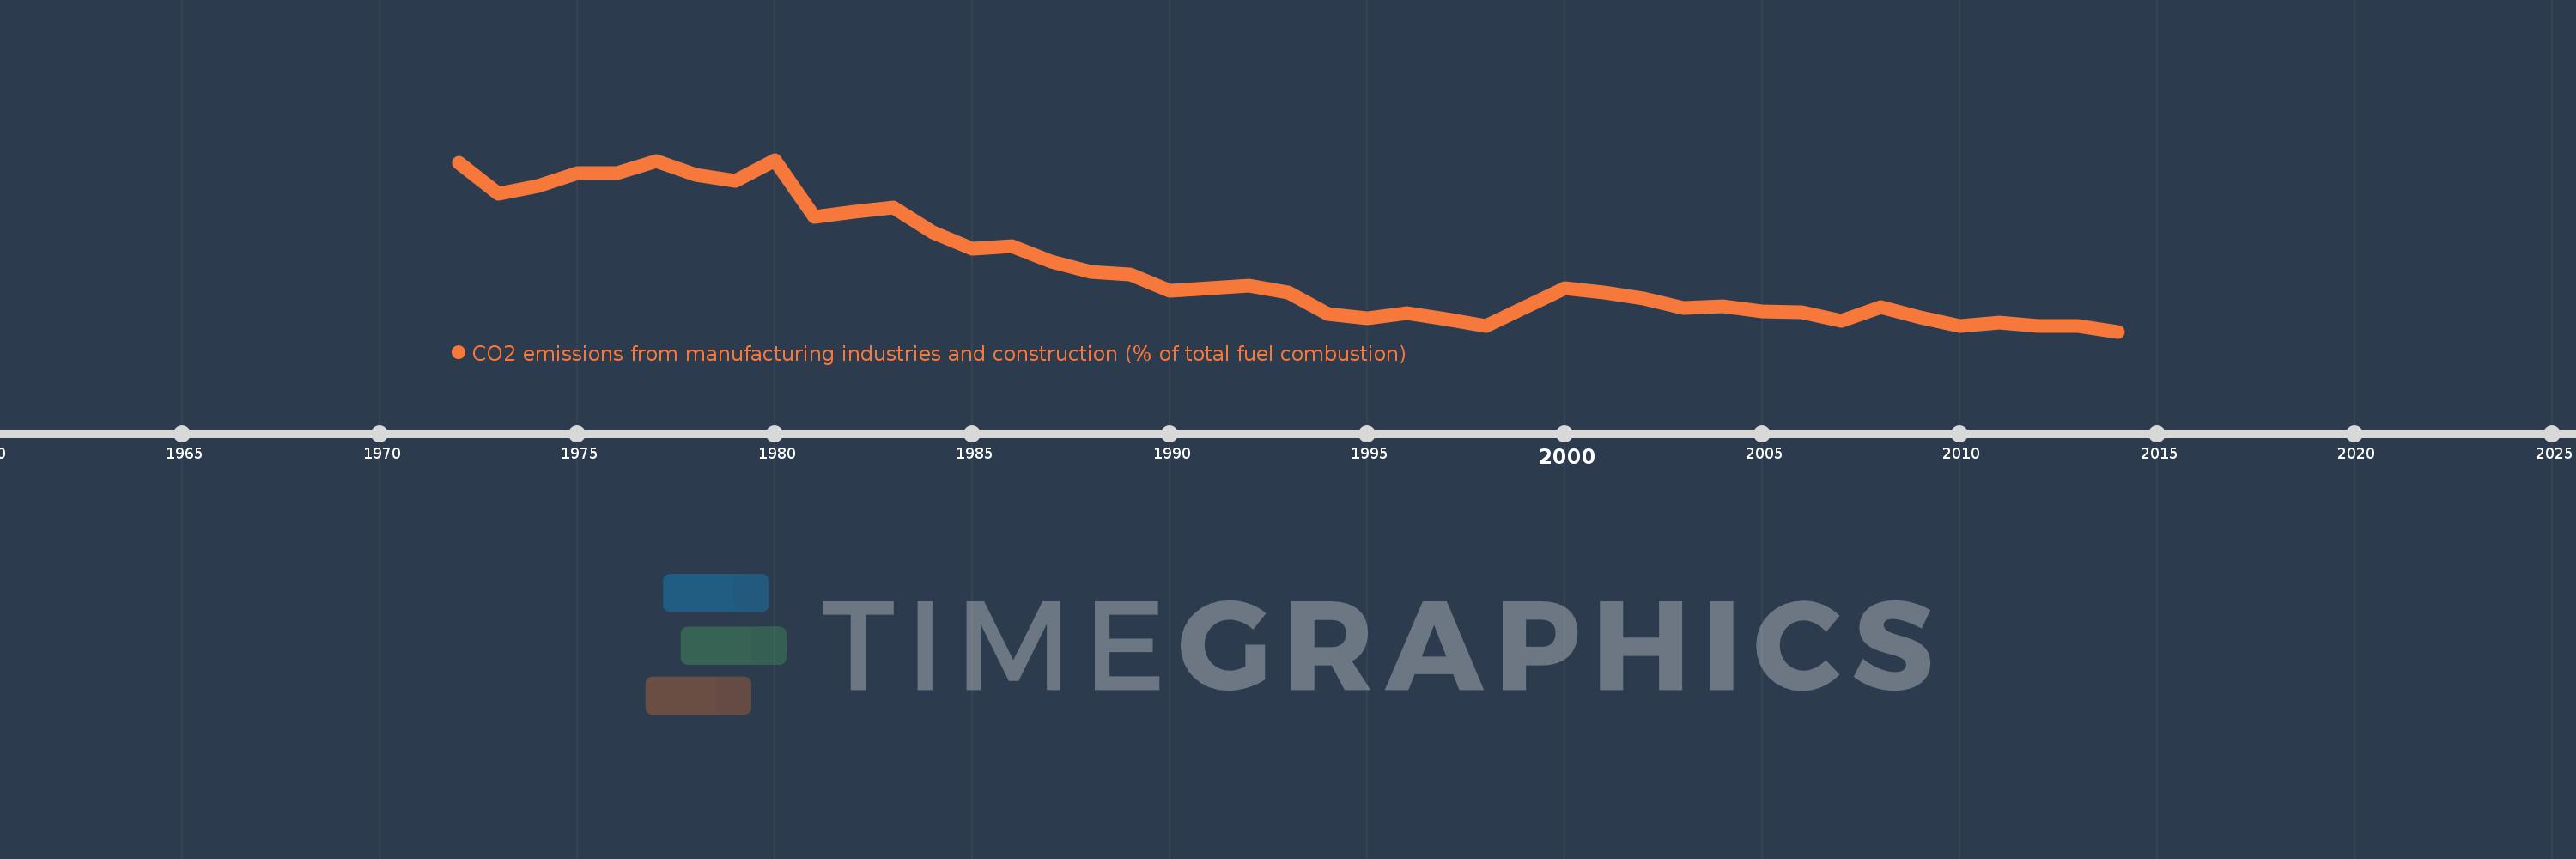
CO2 emissions from manufacturing industries and construction (% of total fuel combustion)
2014,2013,2012,2011,2010,2009,2008,2007,2006,2005,2004,2003,2002,2001,2000,1999,1998,1997,1996,1995,1994,1993,1992,1991,1990,1989,1988,1987,1986,1985,1984,1983,1982,1981,1980,1979,1978,1977,1976,1975,1974,1973,1972
This statistics in other country:
AlbaniaAlgeriaAngolaArab WorldArgentinaArmeniaAustraliaAustriaAzerbaijanBahrainBangladeshBelarusBelgiumBeninBoliviaBosnia and HerzegovinaBotswanaBrazilBrunei DarussalamBulgariaCambodiaCameroonCanadaCaribbean small statesCentral Europe and the BalticsChileChinaColombiaCongo, Dem. Rep.Congo, Rep.Costa RicaCote d'IvoireCroatiaCubaCuracaoCyprusCzech RepublicDenmarkDominican RepublicEarly-demographic dividendEast Asia & PacificEast Asia & Pacific (excluding high income)East Asia & Pacific (IDA & IBRD countries)EcuadorEgypt, Arab Rep.El SalvadorEritreaEstoniaEthiopiaEuro areaEurope & Central AsiaEurope & Central Asia (excluding high income)Europe & Central Asia (IDA & IBRD countries)European UnionFinlandFragile and conflict affected situationsFranceGabonGeorgiaGermanyGhanaGibraltarGreeceGuatemalaHaitiHeavily indebted poor countries (HIPC)High incomeHondurasHong Kong SAR, ChinaHungaryIBRD onlyIcelandIDA & IBRD totalIDA blendIDA onlyIDA totalIndiaIndonesiaIran, Islamic Rep.IraqIrelandIsraelItalyJamaicaJapanJordanKazakhstanKenyaKorea, Dem. People’s Rep.Korea, Rep.KosovoKuwaitKyrgyz RepublicLate-demographic dividendLatin America & Caribbean Latin America & Caribbean (excluding high income)Latin America & the Caribbean (IDA & IBRD countries)LatviaLeast developed countries: UN classificationLebanonLibyaLithuaniaLow & middle incomeLow incomeLower middle incomeLuxembourgMacedonia, FYRMalaysiaMaltaMauritiusMexicoMiddle East & North AfricaMiddle East & North Africa (excluding high income)Middle East & North Africa (IDA & IBRD countries)Middle incomeMoldovaMongoliaMontenegroMoroccoMozambiqueMyanmarNamibiaNepalNetherlandsNew ZealandNicaraguaNigerNigeriaNorth AmericaNorwayOECD membersOmanOther small statesPakistanPanamaParaguayPeruPhilippinesPolandPortugalPost-demographic dividendPre-demographic dividendQatarRomaniaRussian FederationSaudi ArabiaSenegalSerbiaSingaporeSlovak RepublicSloveniaSmall statesSouth AfricaSouth AsiaSouth Asia (IDA & IBRD)South SudanSpainSri LankaSub-Saharan Africa Sub-Saharan Africa (excluding high income)Sub-Saharan Africa (IDA & IBRD countries)SudanSwedenSwitzerlandSyrian Arab RepublicTajikistanTanzaniaThailandTogoTrinidad and TobagoTunisiaTurkeyTurkmenistanUkraineUnited Arab EmiratesUnited KingdomUnited StatesUpper middle incomeUruguayUzbekistanVenezuela, RBVietnamWorldYemen, Rep.ZambiaZimbabwe Timeline:
This timeline shows a graph from 1972 to 2014 of Fragile and conflict affected situations. No data until 1971. Number of actual observations by date: 43.
Source name:
World Development Indicators
Source organization:
IEA Statistics © OECD/IEA 2014 (http://www.iea.org/stats/index.asp), subject to https://www.iea.org/t&c/termsandconditions/
Categories, topics:
Environment
Last updated:
apr 23, 2017
Indicators value changes by year
Maximum:
26.347
jan 1, 1980
At the date of observation
Value
Absolute change
Change from previous value
jan 1, 1972
26.051
+26.051
0.0%
jan 1, 1973
23.077
-2.974
-11.42%
jan 1, 1974
23.773
+0.696
3.01%
jan 1, 1975
25.018
+1.245
5.24%
jan 1, 1976
25.025
+0.007
0.03%
jan 1, 1977
26.246
+1.222
4.88%
jan 1, 1978
24.921
-1.325
-5.05%
jan 1, 1979
24.303
-0.618
-2.48%
jan 1, 1980
26.347
+2.044
8.41%
jan 1, 1981
20.765
-5.582
-21.19%
jan 1, 1982
21.307
+0.542
2.61%
jan 1, 1983
21.709
+0.402
1.89%
jan 1, 1984
19.313
-2.395
-11.03%
jan 1, 1985
17.721
-1.592
-8.24%
jan 1, 1986
17.927
+0.206
1.16%
jan 1, 1987
16.463
-1.464
-8.17%
jan 1, 1988
15.458
-1.005
-6.1%
jan 1, 1989
15.236
-0.223
-1.44%
jan 1, 1990
13.596
-1.64
-10.76%
jan 1, 1991
13.883
+0.287
2.11%
jan 1, 1992
14.11
+0.227
1.63%
jan 1, 1993
13.476
-0.633
-4.49%
jan 1, 1994
11.337
-2.139
-15.88%
jan 1, 1995
10.958
-0.379
-3.35%
jan 1, 1996
11.447
+0.49
4.47%
jan 1, 1997
10.891
-0.556
-4.86%
jan 1, 1998
10.215
-0.676
-6.2%
jan 1, 1999
11.987
+1.772
17.35%
jan 1, 2000
13.9
+1.913
15.96%
jan 1, 2001
13.434
-0.467
-3.36%
jan 1, 2002
12.869
-0.565
-4.21%
jan 1, 2003
11.915
-0.954
-7.41%
jan 1, 2004
12.074
+0.16
1.34%
jan 1, 2005
11.623
-0.451
-3.74%
jan 1, 2006
11.526
-0.097
-0.84%
jan 1, 2007
10.691
-0.835
-7.25%
jan 1, 2008
12.038
+1.347
12.6%
jan 1, 2009
10.985
-1.053
-8.75%
jan 1, 2010
10.192
-0.792
-7.21%
jan 1, 2011
10.529
+0.337
3.31%
jan 1, 2012
10.162
-0.367
-3.49%
jan 1, 2013
10.226
+0.064
0.63%
jan 1, 2014
9.646
-0.58
-5.67%
Ranking of countries by current statistics by years


Comments: