29
/
en
AIzaSyAYiBZKx7MnpbEhh9jyipgxe19OcubqV5w
April 1, 2024
144116
Guatemala
GTM
true
2
1
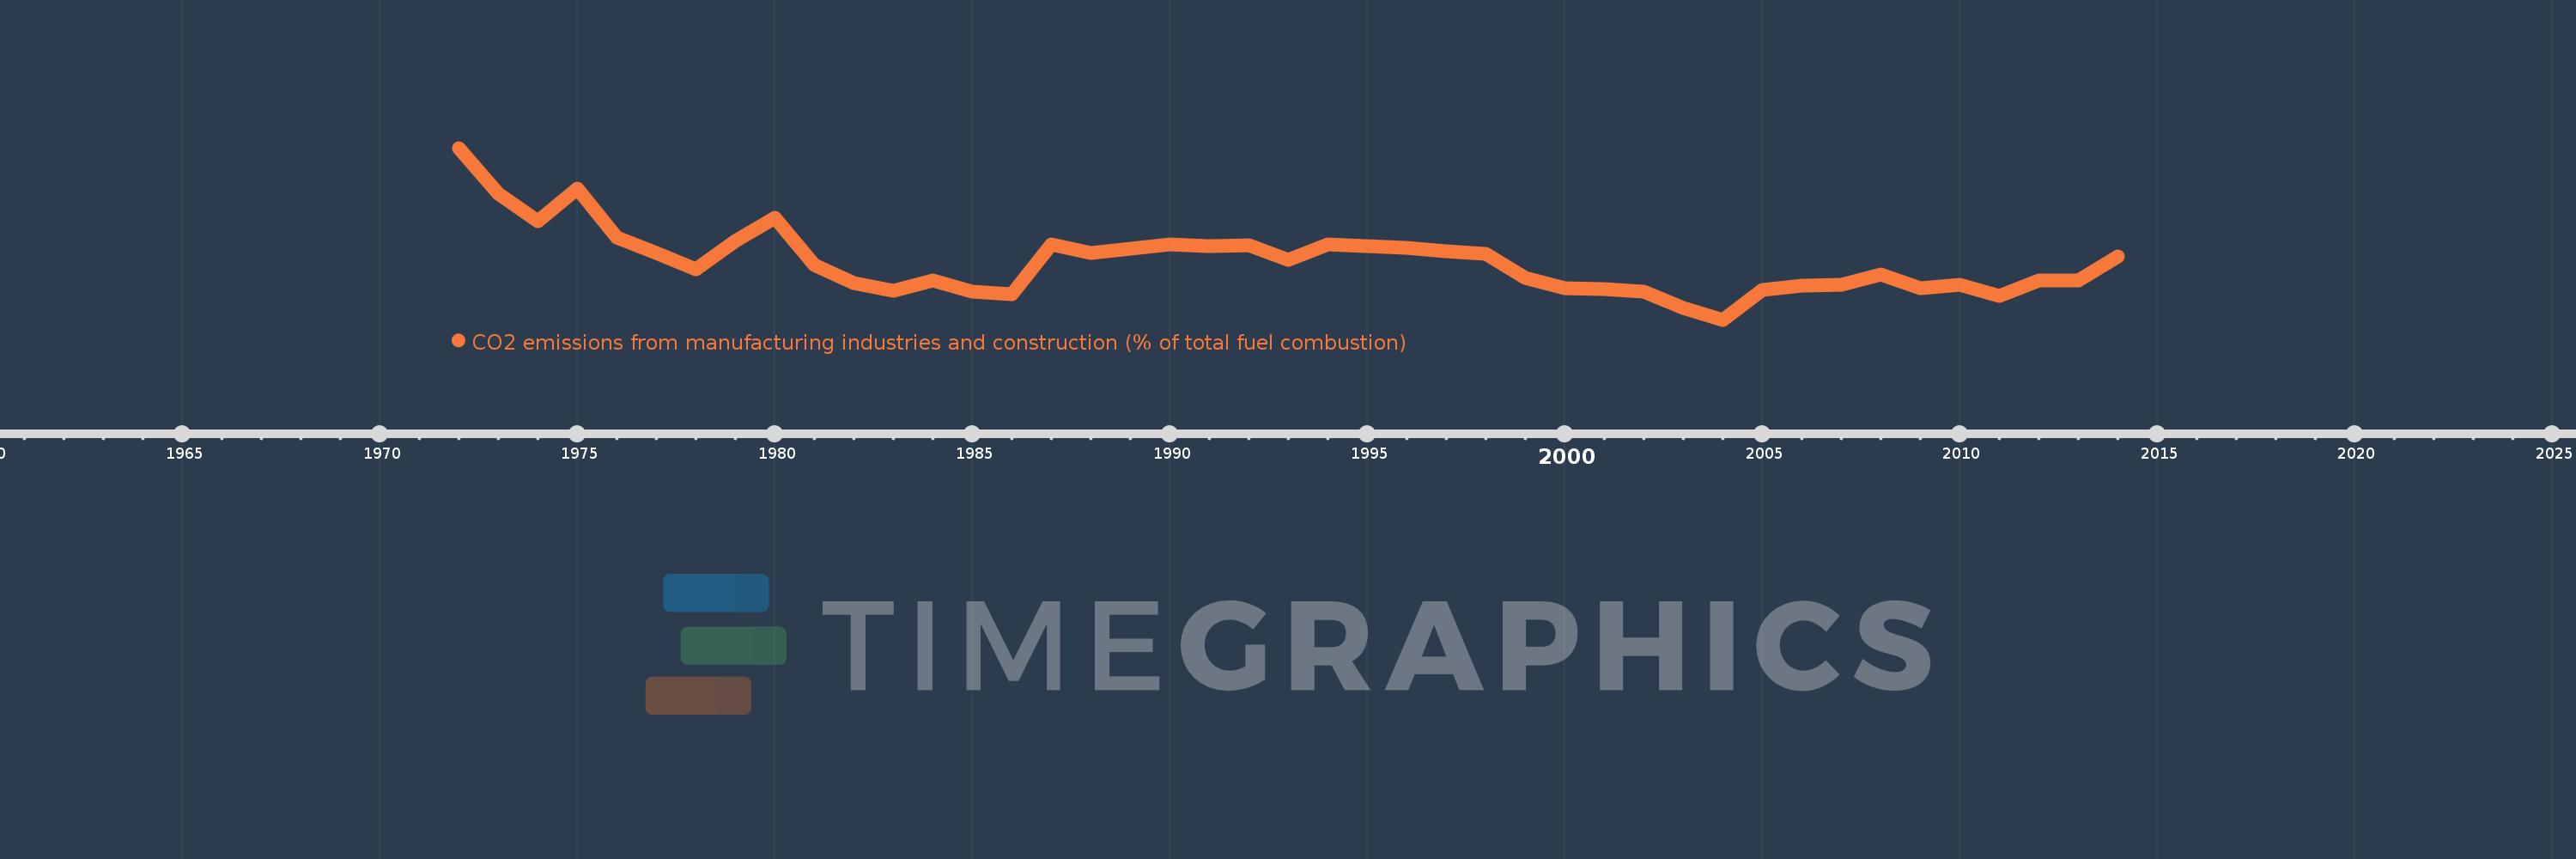
CO2 emissions from manufacturing industries and construction (% of total fuel combustion)
2014,2013,2012,2011,2010,2009,2008,2007,2006,2005,2004,2003,2002,2001,2000,1999,1998,1997,1996,1995,1994,1993,1992,1991,1990,1989,1988,1987,1986,1985,1984,1983,1982,1981,1980,1979,1978,1977,1976,1975,1974,1973,1972
This statistics in other country:
AlbaniaAlgeriaAngolaArab WorldArgentinaArmeniaAustraliaAustriaAzerbaijanBahrainBangladeshBelarusBelgiumBeninBoliviaBosnia and HerzegovinaBotswanaBrazilBrunei DarussalamBulgariaCambodiaCameroonCanadaCaribbean small statesCentral Europe and the BalticsChileChinaColombiaCongo, Dem. Rep.Congo, Rep.Costa RicaCote d'IvoireCroatiaCubaCuracaoCyprusCzech RepublicDenmarkDominican RepublicEarly-demographic dividendEast Asia & PacificEast Asia & Pacific (excluding high income)East Asia & Pacific (IDA & IBRD countries)EcuadorEgypt, Arab Rep.El SalvadorEritreaEstoniaEthiopiaEuro areaEurope & Central AsiaEurope & Central Asia (excluding high income)Europe & Central Asia (IDA & IBRD countries)European UnionFinlandFragile and conflict affected situationsFranceGabonGeorgiaGermanyGhanaGibraltarGreeceGuatemalaHaitiHeavily indebted poor countries (HIPC)High incomeHondurasHong Kong SAR, ChinaHungaryIBRD onlyIcelandIDA & IBRD totalIDA blendIDA onlyIDA totalIndiaIndonesiaIran, Islamic Rep.IraqIrelandIsraelItalyJamaicaJapanJordanKazakhstanKenyaKorea, Dem. People’s Rep.Korea, Rep.KosovoKuwaitKyrgyz RepublicLate-demographic dividendLatin America & Caribbean Latin America & Caribbean (excluding high income)Latin America & the Caribbean (IDA & IBRD countries)LatviaLeast developed countries: UN classificationLebanonLibyaLithuaniaLow & middle incomeLow incomeLower middle incomeLuxembourgMacedonia, FYRMalaysiaMaltaMauritiusMexicoMiddle East & North AfricaMiddle East & North Africa (excluding high income)Middle East & North Africa (IDA & IBRD countries)Middle incomeMoldovaMongoliaMontenegroMoroccoMozambiqueMyanmarNamibiaNepalNetherlandsNew ZealandNicaraguaNigerNigeriaNorth AmericaNorwayOECD membersOmanOther small statesPakistanPanamaParaguayPeruPhilippinesPolandPortugalPost-demographic dividendPre-demographic dividendQatarRomaniaRussian FederationSaudi ArabiaSenegalSerbiaSingaporeSlovak RepublicSloveniaSmall statesSouth AfricaSouth AsiaSouth Asia (IDA & IBRD)South SudanSpainSri LankaSub-Saharan Africa Sub-Saharan Africa (excluding high income)Sub-Saharan Africa (IDA & IBRD countries)SudanSwedenSwitzerlandSyrian Arab RepublicTajikistanTanzaniaThailandTogoTrinidad and TobagoTunisiaTurkeyTurkmenistanUkraineUnited Arab EmiratesUnited KingdomUnited StatesUpper middle incomeUruguayUzbekistanVenezuela, RBVietnamWorldYemen, Rep.ZambiaZimbabwe Timeline:
This timeline shows a graph from 1972 to 2014 of Guatemala. No data until 1971. Number of actual observations by date: 43.
Source name:
World Development Indicators
Source organization:
IEA Statistics © OECD/IEA 2014 (http://www.iea.org/stats/index.asp), subject to https://www.iea.org/t&c/termsandconditions/
Categories, topics:
Environment
Last updated:
apr 23, 2017
Indicators value changes by year
Maximum:
38.496
jan 1, 1972
At the date of observation
Value
Absolute change
Change from previous value
jan 1, 1972
38.496
+38.496
0.0%
jan 1, 1973
30.924
-7.572
-19.67%
jan 1, 1974
26.236
-4.688
-15.16%
jan 1, 1975
31.734
+5.499
20.96%
jan 1, 1976
23.588
-8.146
-25.67%
jan 1, 1977
21.034
-2.554
-10.83%
jan 1, 1978
18.263
-2.771
-13.17%
jan 1, 1979
22.933
+4.67
25.57%
jan 1, 1980
26.841
+3.908
17.04%
jan 1, 1981
19.002
-7.838
-29.2%
jan 1, 1982
15.978
-3.024
-15.92%
jan 1, 1983
14.734
-1.244
-7.79%
jan 1, 1984
16.364
+1.63
11.06%
jan 1, 1985
14.563
-1.801
-11.0%
jan 1, 1986
14.151
-0.412
-2.83%
jan 1, 1987
22.414
+8.263
58.39%
jan 1, 1988
20.956
-1.458
-6.5%
jan 1, 1989
21.724
+0.768
3.67%
jan 1, 1990
22.368
+0.644
2.97%
jan 1, 1991
22.118
-0.25
-1.12%
jan 1, 1992
22.287
+0.169
0.76%
jan 1, 1993
19.905
-2.382
-10.69%
jan 1, 1994
22.462
+2.557
12.85%
jan 1, 1995
22.154
-0.308
-1.37%
jan 1, 1996
21.843
-0.311
-1.41%
jan 1, 1997
21.329
-0.514
-2.35%
jan 1, 1998
20.833
-0.495
-2.32%
jan 1, 1999
16.885
-3.949
-18.95%
jan 1, 2000
15.047
-1.838
-10.89%
jan 1, 2001
15.035
-0.012
-0.08%
jan 1, 2002
14.572
-0.463
-3.08%
jan 1, 2003
11.813
-2.758
-18.93%
jan 1, 2004
9.855
-1.959
-16.58%
jan 1, 2005
14.844
+4.989
50.63%
jan 1, 2006
15.537
+0.693
4.67%
jan 1, 2007
15.616
+0.079
0.51%
jan 1, 2008
17.35
+1.733
11.1%
jan 1, 2009
15.122
-2.228
-12.84%
jan 1, 2010
15.672
+0.55
3.64%
jan 1, 2011
13.857
-1.816
-11.59%
jan 1, 2012
16.412
+2.556
18.44%
jan 1, 2013
16.431
+0.018
0.11%
jan 1, 2014
20.458
+4.028
24.51%
Ranking of countries by current statistics by years


Comments: