29
/
en
AIzaSyAYiBZKx7MnpbEhh9jyipgxe19OcubqV5w
April 1, 2024
38805
IDA only
IDX
false
2
1
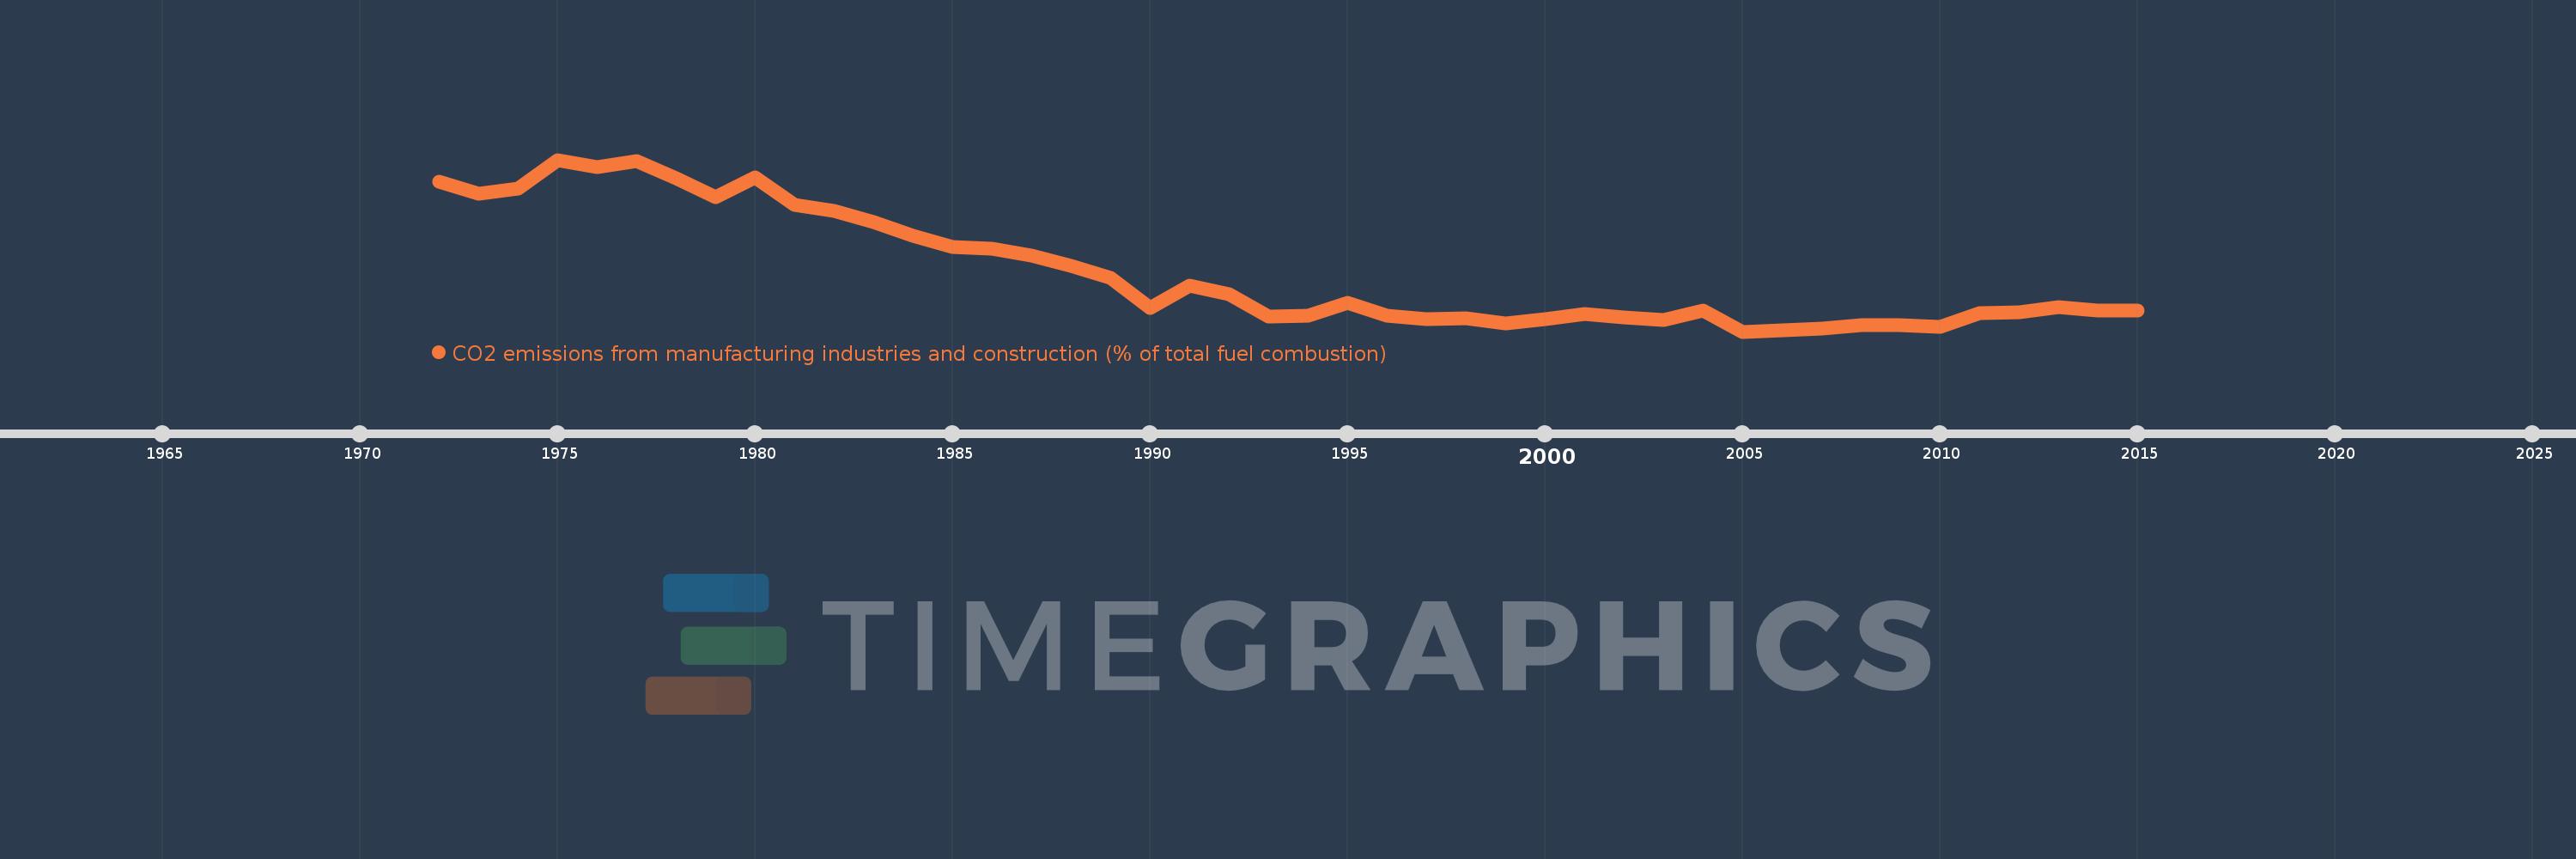
CO2 emissions from manufacturing industries and construction (% of total fuel combustion)
2015,2014,2013,2012,2011,2010,2009,2008,2007,2006,2005,2004,2003,2002,2001,2000,1999,1998,1997,1996,1995,1994,1993,1992,1991,1990,1989,1988,1987,1986,1985,1984,1983,1982,1981,1980,1979,1978,1977,1976,1975,1974,1973,1972
This statistics in other country:
AlbaniaAlgeriaAngolaArab WorldArgentinaArmeniaAustraliaAustriaAzerbaijanBahrainBangladeshBelarusBelgiumBeninBoliviaBosnia and HerzegovinaBotswanaBrazilBrunei DarussalamBulgariaCambodiaCameroonCanadaCaribbean small statesCentral Europe and the BalticsChileChinaColombiaCongo, Dem. Rep.Congo, Rep.Costa RicaCote d'IvoireCroatiaCubaCuracaoCyprusCzech RepublicDenmarkDominican RepublicEarly-demographic dividendEast Asia & PacificEast Asia & Pacific (excluding high income)East Asia & Pacific (IDA & IBRD countries)EcuadorEgypt, Arab Rep.El SalvadorEritreaEstoniaEthiopiaEuro areaEurope & Central AsiaEurope & Central Asia (excluding high income)Europe & Central Asia (IDA & IBRD countries)European UnionFinlandFragile and conflict affected situationsFranceGabonGeorgiaGermanyGhanaGibraltarGreeceGuatemalaHaitiHeavily indebted poor countries (HIPC)High incomeHondurasHong Kong SAR, ChinaHungaryIBRD onlyIcelandIDA & IBRD totalIDA blendIDA onlyIDA totalIndiaIndonesiaIran, Islamic Rep.IraqIrelandIsraelItalyJamaicaJapanJordanKazakhstanKenyaKorea, Dem. People’s Rep.Korea, Rep.KosovoKuwaitKyrgyz RepublicLate-demographic dividendLatin America & Caribbean Latin America & Caribbean (excluding high income)Latin America & the Caribbean (IDA & IBRD countries)LatviaLeast developed countries: UN classificationLebanonLibyaLithuaniaLow & middle incomeLow incomeLower middle incomeLuxembourgMacedonia, FYRMalaysiaMaltaMauritiusMexicoMiddle East & North AfricaMiddle East & North Africa (excluding high income)Middle East & North Africa (IDA & IBRD countries)Middle incomeMoldovaMongoliaMontenegroMoroccoMozambiqueMyanmarNamibiaNepalNetherlandsNew ZealandNicaraguaNigerNigeriaNorth AmericaNorwayOECD membersOmanOther small statesPakistanPanamaParaguayPeruPhilippinesPolandPortugalPost-demographic dividendPre-demographic dividendQatarRomaniaRussian FederationSaudi ArabiaSenegalSerbiaSingaporeSlovak RepublicSloveniaSmall statesSouth AfricaSouth AsiaSouth Asia (IDA & IBRD)South SudanSpainSri LankaSub-Saharan Africa Sub-Saharan Africa (excluding high income)Sub-Saharan Africa (IDA & IBRD countries)SudanSwedenSwitzerlandSyrian Arab RepublicTajikistanTanzaniaThailandTogoTrinidad and TobagoTunisiaTurkeyTurkmenistanUkraineUnited Arab EmiratesUnited KingdomUnited StatesUpper middle incomeUruguayUzbekistanVenezuela, RBVietnamWorldYemen, Rep.ZambiaZimbabwe Timeline:
This timeline shows a graph from 1972 to 2015 of IDA only. No data until 1971. Number of actual observations by date: 44.
Source name:
World Development Indicators
Source organization:
IEA Statistics © OECD/IEA 2014 (http://www.iea.org/stats/index.asp), subject to https://www.iea.org/t&c/termsandconditions/
Categories, topics:
Environment
Last updated:
apr 23, 2017
Indicators value changes by year
Minimum:
13.869
jan 1, 2005
Maximum:
32.874
jan 1, 1975
At the date of observation
Value
Absolute change
Change from previous value
jan 1, 1972
30.411
+30.411
0.0%
jan 1, 1973
29.088
-1.322
-4.35%
jan 1, 1974
29.716
+0.628
2.16%
jan 1, 1975
32.874
+3.157
10.62%
jan 1, 1976
32.091
-0.782
-2.38%
jan 1, 1977
32.736
+0.645
2.01%
jan 1, 1978
30.816
-1.92
-5.86%
jan 1, 1979
28.733
-2.083
-6.76%
jan 1, 1980
30.926
+2.193
7.63%
jan 1, 1981
27.871
-3.055
-9.88%
jan 1, 1982
27.267
-0.604
-2.17%
jan 1, 1983
25.96
-1.307
-4.79%
jan 1, 1984
24.457
-1.503
-5.79%
jan 1, 1985
23.276
-1.18
-4.83%
jan 1, 1986
23.034
-0.243
-1.04%
jan 1, 1987
22.236
-0.798
-3.46%
jan 1, 1988
21.175
-1.061
-4.77%
jan 1, 1989
19.802
-1.373
-6.48%
jan 1, 1990
16.525
-3.277
-16.55%
jan 1, 1991
18.988
+2.463
14.9%
jan 1, 1992
17.956
-1.031
-5.43%
jan 1, 1993
15.539
-2.417
-13.46%
jan 1, 1994
15.603
+0.063
0.41%
jan 1, 1995
17.081
+1.479
9.48%
jan 1, 1996
15.658
-1.423
-8.33%
jan 1, 1997
15.239
-0.419
-2.68%
jan 1, 1998
15.368
+0.129
0.85%
jan 1, 1999
14.755
-0.613
-3.99%
jan 1, 2000
15.277
+0.522
3.54%
jan 1, 2001
15.792
+0.515
3.37%
jan 1, 2002
15.425
-0.367
-2.33%
jan 1, 2003
15.123
-0.302
-1.96%
jan 1, 2004
16.244
+1.121
7.41%
jan 1, 2005
13.869
-2.374
-14.62%
jan 1, 2006
14.034
+0.165
1.19%
jan 1, 2007
14.213
+0.179
1.27%
jan 1, 2008
14.585
+0.372
2.62%
jan 1, 2009
14.598
+0.013
0.09%
jan 1, 2010
14.411
-0.187
-1.28%
jan 1, 2011
15.924
+1.512
10.49%
jan 1, 2012
16.03
+0.106
0.67%
jan 1, 2013
16.535
+0.505
3.15%
jan 1, 2014
16.162
-0.372
-2.25%
jan 1, 2015
16.227
+0.065
0.4%
Ranking of countries by current statistics by years


Comments: