29
/
en
AIzaSyAYiBZKx7MnpbEhh9jyipgxe19OcubqV5w
April 1, 2024
100916
Canada
CAN
true
2
1
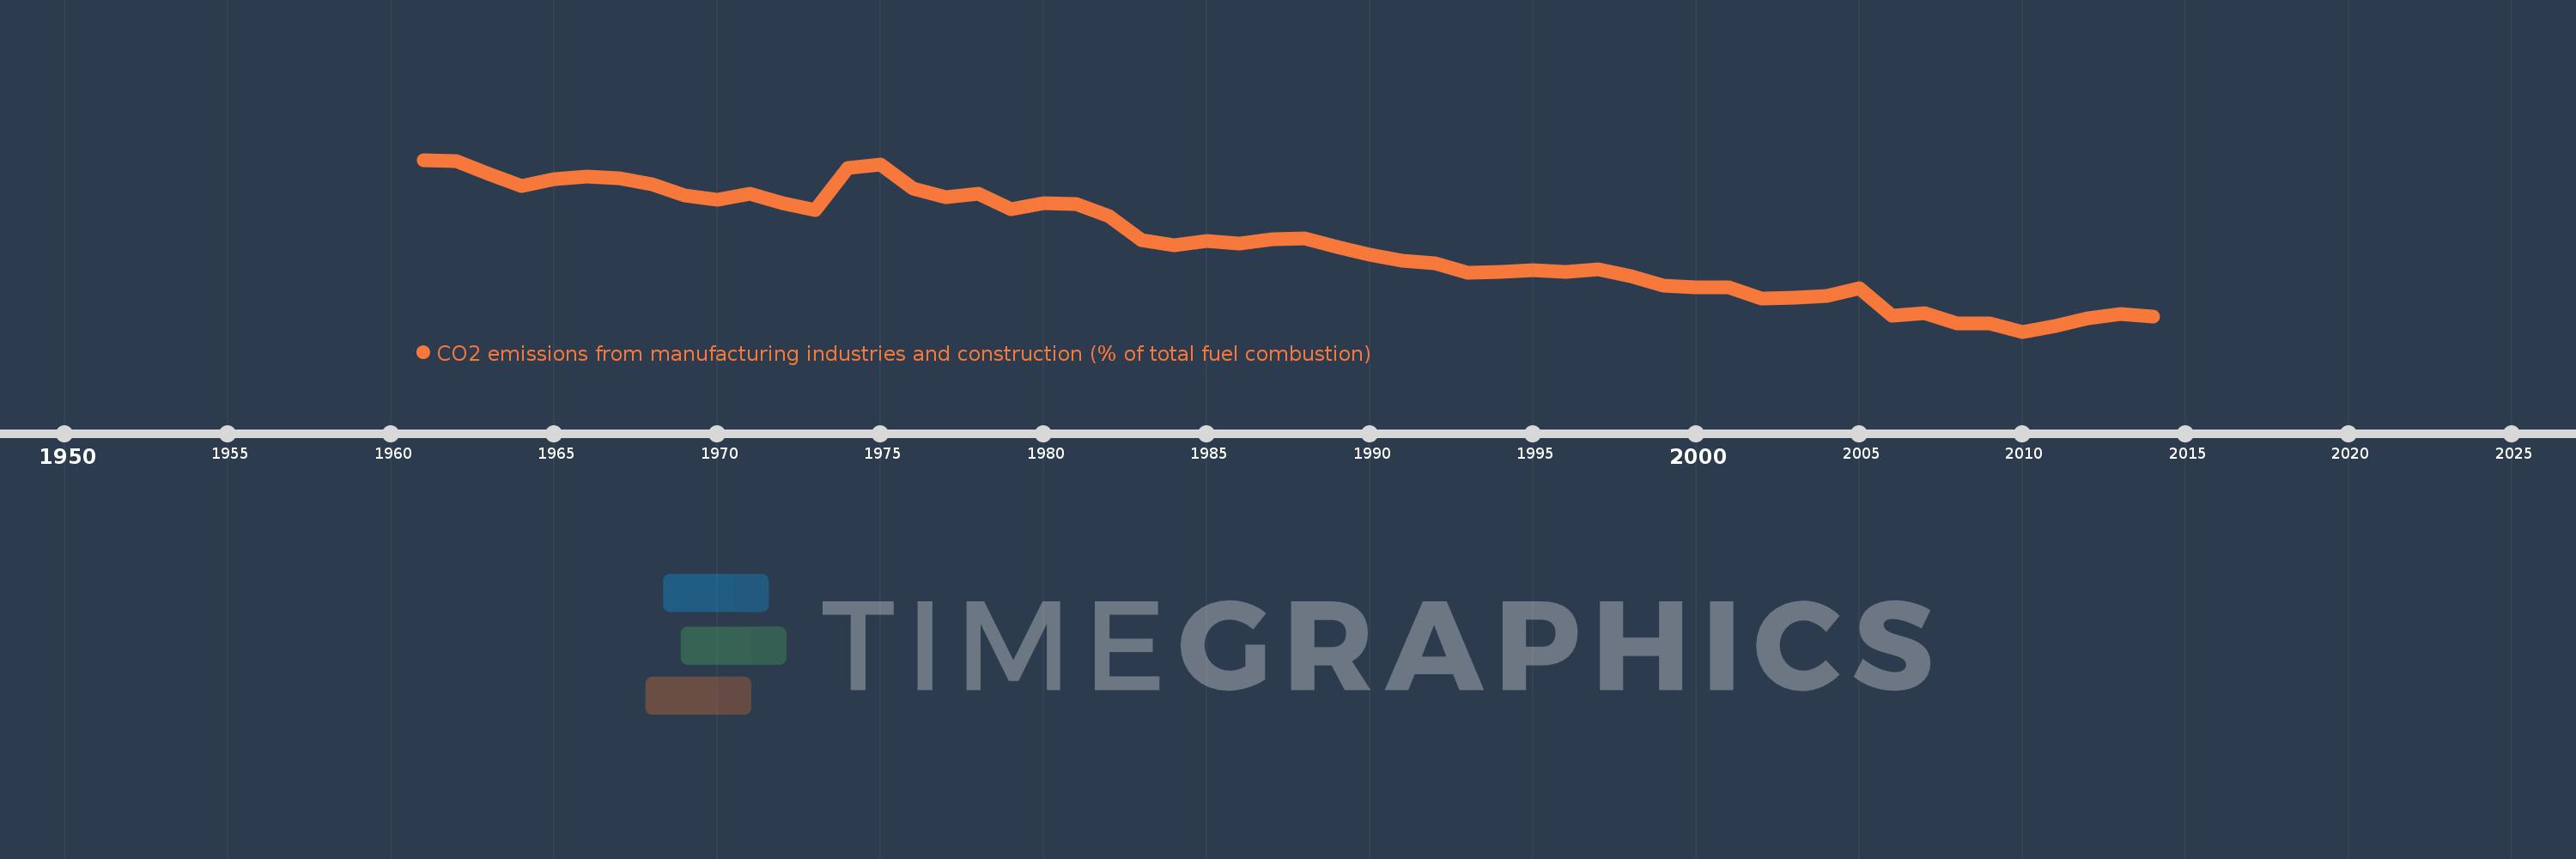
CO2 emissions from manufacturing industries and construction (% of total fuel combustion)
2014,2013,2012,2011,2010,2009,2008,2007,2006,2005,2004,2003,2002,2001,2000,1999,1998,1997,1996,1995,1994,1993,1992,1991,1990,1989,1988,1987,1986,1985,1984,1983,1982,1981,1980,1979,1978,1977,1976,1975,1974,1973,1972,1971,1970,1969,1968,1967,1966,1965,1964,1963,1962,1961
This statistics in other country:
AlbaniaAlgeriaAngolaArab WorldArgentinaArmeniaAustraliaAustriaAzerbaijanBahrainBangladeshBelarusBelgiumBeninBoliviaBosnia and HerzegovinaBotswanaBrazilBrunei DarussalamBulgariaCambodiaCameroonCanadaCaribbean small statesCentral Europe and the BalticsChileChinaColombiaCongo, Dem. Rep.Congo, Rep.Costa RicaCote d'IvoireCroatiaCubaCuracaoCyprusCzech RepublicDenmarkDominican RepublicEarly-demographic dividendEast Asia & PacificEast Asia & Pacific (excluding high income)East Asia & Pacific (IDA & IBRD countries)EcuadorEgypt, Arab Rep.El SalvadorEritreaEstoniaEthiopiaEuro areaEurope & Central AsiaEurope & Central Asia (excluding high income)Europe & Central Asia (IDA & IBRD countries)European UnionFinlandFragile and conflict affected situationsFranceGabonGeorgiaGermanyGhanaGibraltarGreeceGuatemalaHaitiHeavily indebted poor countries (HIPC)High incomeHondurasHong Kong SAR, ChinaHungaryIBRD onlyIcelandIDA & IBRD totalIDA blendIDA onlyIDA totalIndiaIndonesiaIran, Islamic Rep.IraqIrelandIsraelItalyJamaicaJapanJordanKazakhstanKenyaKorea, Dem. People’s Rep.Korea, Rep.KosovoKuwaitKyrgyz RepublicLate-demographic dividendLatin America & Caribbean Latin America & Caribbean (excluding high income)Latin America & the Caribbean (IDA & IBRD countries)LatviaLeast developed countries: UN classificationLebanonLibyaLithuaniaLow & middle incomeLow incomeLower middle incomeLuxembourgMacedonia, FYRMalaysiaMaltaMauritiusMexicoMiddle East & North AfricaMiddle East & North Africa (excluding high income)Middle East & North Africa (IDA & IBRD countries)Middle incomeMoldovaMongoliaMontenegroMoroccoMozambiqueMyanmarNamibiaNepalNetherlandsNew ZealandNicaraguaNigerNigeriaNorth AmericaNorwayOECD membersOmanOther small statesPakistanPanamaParaguayPeruPhilippinesPolandPortugalPost-demographic dividendPre-demographic dividendQatarRomaniaRussian FederationSaudi ArabiaSenegalSerbiaSingaporeSlovak RepublicSloveniaSmall statesSouth AfricaSouth AsiaSouth Asia (IDA & IBRD)South SudanSpainSri LankaSub-Saharan Africa Sub-Saharan Africa (excluding high income)Sub-Saharan Africa (IDA & IBRD countries)SudanSwedenSwitzerlandSyrian Arab RepublicTajikistanTanzaniaThailandTogoTrinidad and TobagoTunisiaTurkeyTurkmenistanUkraineUnited Arab EmiratesUnited KingdomUnited StatesUpper middle incomeUruguayUzbekistanVenezuela, RBVietnamWorldYemen, Rep.ZambiaZimbabwe Timeline:
This timeline shows a graph from 1961 to 2014 of Canada. No data until 1960. Number of actual observations by date: 54.
Source name:
World Development Indicators
Source organization:
IEA Statistics © OECD/IEA 2014 (http://www.iea.org/stats/index.asp), subject to https://www.iea.org/t&c/termsandconditions/
Categories, topics:
Environment
Last updated:
apr 23, 2017
Indicators value changes by year
Minimum:
12.309
jan 1, 2010
Maximum:
26.435
jan 1, 1961
At the date of observation
Value
Absolute change
Change from previous value
jan 1, 1961
26.435
+26.435
0.0%
jan 1, 1962
26.298
-0.137
-0.52%
jan 1, 1963
25.299
-1.0
-3.8%
jan 1, 1964
24.296
-1.002
-3.96%
jan 1, 1965
24.838
+0.541
2.23%
jan 1, 1966
25.053
+0.216
0.87%
jan 1, 1967
24.906
-0.147
-0.59%
jan 1, 1968
24.411
-0.495
-1.99%
jan 1, 1969
23.51
-0.901
-3.69%
jan 1, 1970
23.183
-0.327
-1.39%
jan 1, 1971
23.654
+0.472
2.03%
jan 1, 1972
22.84
-0.814
-3.44%
jan 1, 1973
22.304
-0.536
-2.35%
jan 1, 1974
25.771
+3.468
15.55%
jan 1, 1975
26.027
+0.255
0.99%
jan 1, 1976
24.094
-1.933
-7.43%
jan 1, 1977
23.341
-0.752
-3.12%
jan 1, 1978
23.625
+0.284
1.22%
jan 1, 1979
22.392
-1.233
-5.22%
jan 1, 1980
22.846
+0.454
2.03%
jan 1, 1981
22.808
-0.038
-0.17%
jan 1, 1982
21.779
-1.03
-4.52%
jan 1, 1983
19.85
-1.928
-8.85%
jan 1, 1984
19.395
-0.455
-2.29%
jan 1, 1985
19.792
+0.397
2.05%
jan 1, 1986
19.532
-0.26
-1.31%
jan 1, 1987
19.921
+0.388
1.99%
jan 1, 1988
19.987
+0.067
0.33%
jan 1, 1989
19.259
-0.729
-3.65%
jan 1, 1990
18.665
-0.594
-3.08%
jan 1, 1991
18.104
-0.561
-3.0%
jan 1, 1992
17.901
-0.203
-1.12%
jan 1, 1993
17.144
-0.757
-4.23%
jan 1, 1994
17.217
+0.073
0.43%
jan 1, 1995
17.349
+0.132
0.76%
jan 1, 1996
17.194
-0.155
-0.9%
jan 1, 1997
17.442
+0.249
1.45%
jan 1, 1998
16.869
-0.574
-3.29%
jan 1, 1999
16.097
-0.771
-4.57%
jan 1, 2000
15.924
-0.173
-1.08%
jan 1, 2001
15.95
+0.026
0.16%
jan 1, 2002
15.024
-0.926
-5.81%
jan 1, 2003
15.116
+0.093
0.62%
jan 1, 2004
15.243
+0.127
0.84%
jan 1, 2005
15.876
+0.633
4.15%
jan 1, 2006
13.591
-2.285
-14.4%
jan 1, 2007
13.807
+0.216
1.59%
jan 1, 2008
12.997
-0.81
-5.87%
jan 1, 2009
13.013
+0.016
0.13%
jan 1, 2010
12.309
-0.704
-5.41%
jan 1, 2011
12.761
+0.452
3.67%
jan 1, 2012
13.405
+0.644
5.04%
jan 1, 2013
13.788
+0.383
2.86%
jan 1, 2014
13.54
-0.247
-1.79%
Ranking of countries by current statistics by years


Comments: