29
/
en
AIzaSyAYiBZKx7MnpbEhh9jyipgxe19OcubqV5w
April 1, 2024
220577
Paraguay
PRY
true
2
1
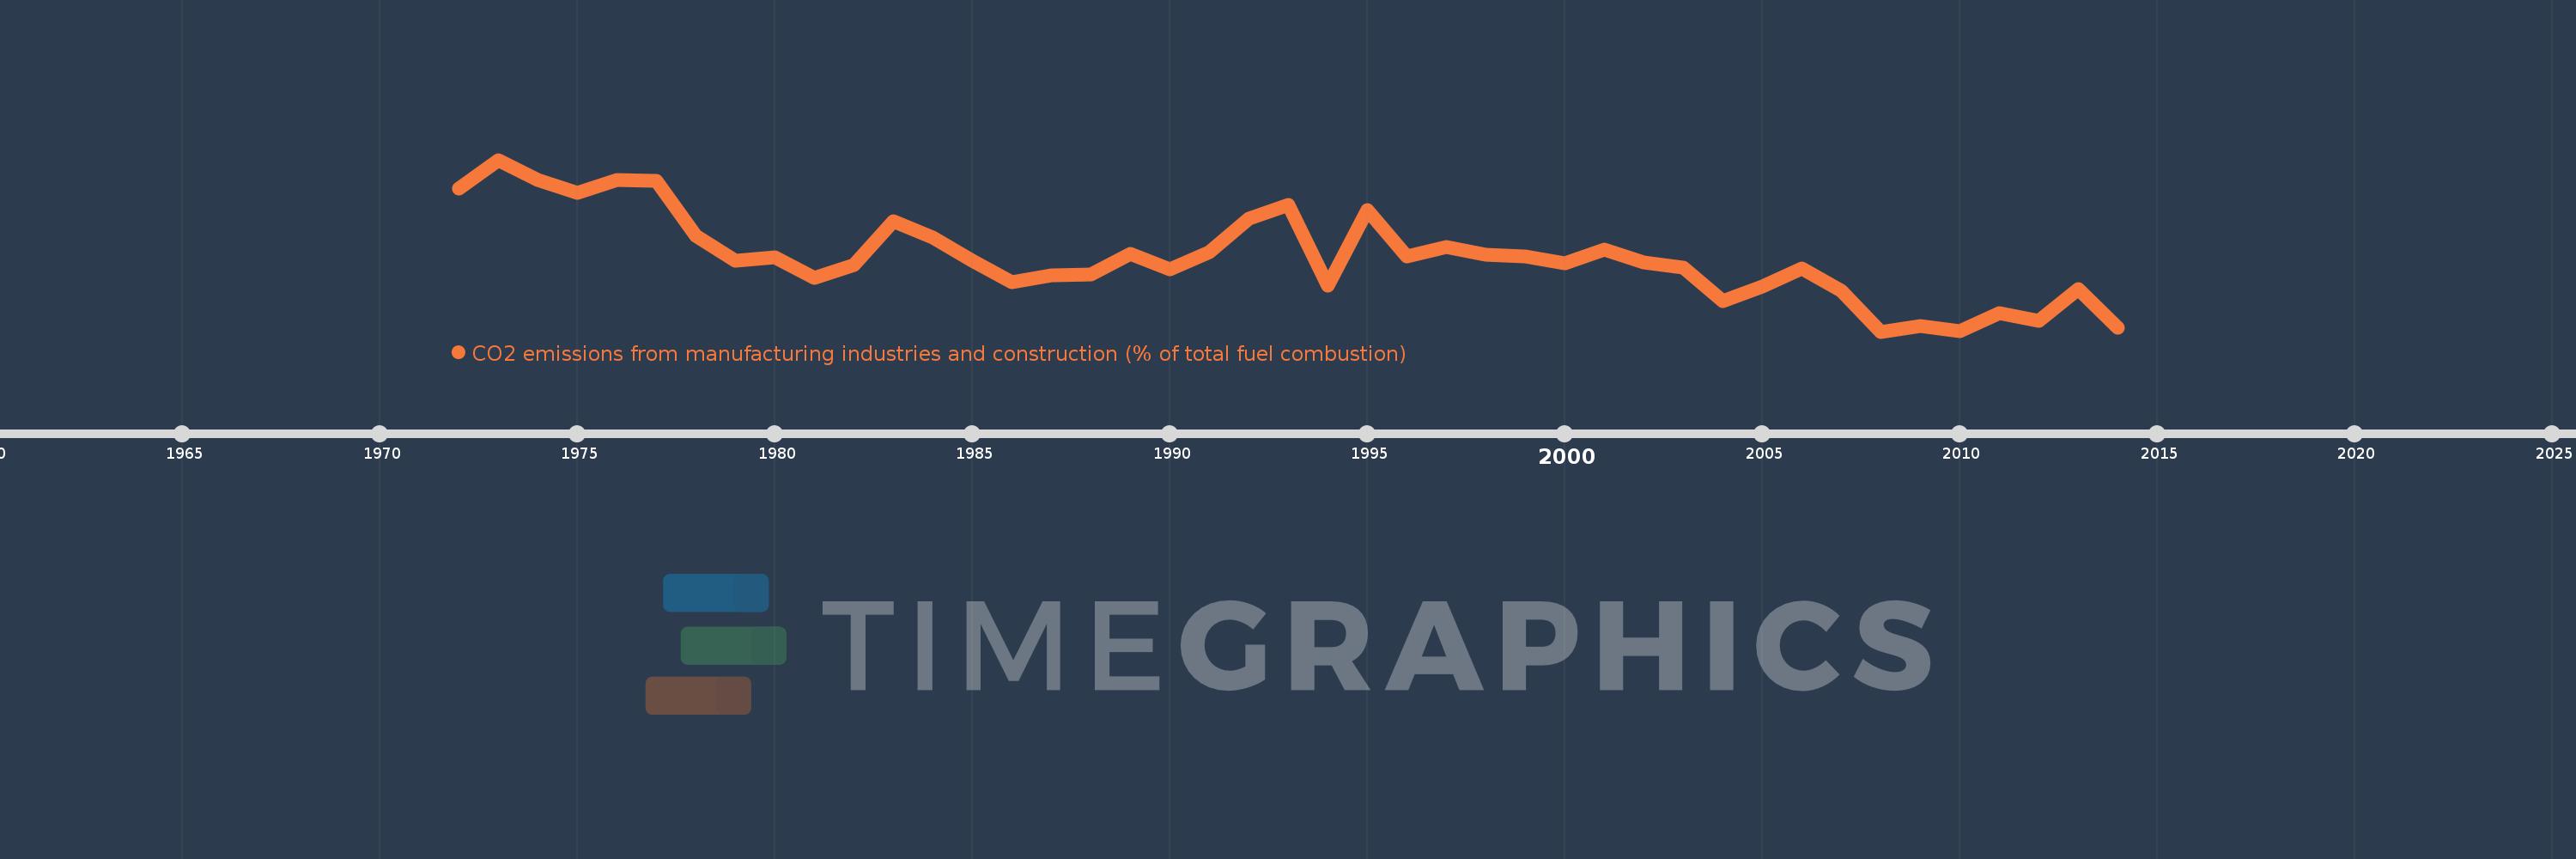
CO2 emissions from manufacturing industries and construction (% of total fuel combustion)
2014,2013,2012,2011,2010,2009,2008,2007,2006,2005,2004,2003,2002,2001,2000,1999,1998,1997,1996,1995,1994,1993,1992,1991,1990,1989,1988,1987,1986,1985,1984,1983,1982,1981,1980,1979,1978,1977,1976,1975,1974,1973,1972
This statistics in other country:
AlbaniaAlgeriaAngolaArab WorldArgentinaArmeniaAustraliaAustriaAzerbaijanBahrainBangladeshBelarusBelgiumBeninBoliviaBosnia and HerzegovinaBotswanaBrazilBrunei DarussalamBulgariaCambodiaCameroonCanadaCaribbean small statesCentral Europe and the BalticsChileChinaColombiaCongo, Dem. Rep.Congo, Rep.Costa RicaCote d'IvoireCroatiaCubaCuracaoCyprusCzech RepublicDenmarkDominican RepublicEarly-demographic dividendEast Asia & PacificEast Asia & Pacific (excluding high income)East Asia & Pacific (IDA & IBRD countries)EcuadorEgypt, Arab Rep.El SalvadorEritreaEstoniaEthiopiaEuro areaEurope & Central AsiaEurope & Central Asia (excluding high income)Europe & Central Asia (IDA & IBRD countries)European UnionFinlandFragile and conflict affected situationsFranceGabonGeorgiaGermanyGhanaGibraltarGreeceGuatemalaHaitiHeavily indebted poor countries (HIPC)High incomeHondurasHong Kong SAR, ChinaHungaryIBRD onlyIcelandIDA & IBRD totalIDA blendIDA onlyIDA totalIndiaIndonesiaIran, Islamic Rep.IraqIrelandIsraelItalyJamaicaJapanJordanKazakhstanKenyaKorea, Dem. People’s Rep.Korea, Rep.KosovoKuwaitKyrgyz RepublicLate-demographic dividendLatin America & Caribbean Latin America & Caribbean (excluding high income)Latin America & the Caribbean (IDA & IBRD countries)LatviaLeast developed countries: UN classificationLebanonLibyaLithuaniaLow & middle incomeLow incomeLower middle incomeLuxembourgMacedonia, FYRMalaysiaMaltaMauritiusMexicoMiddle East & North AfricaMiddle East & North Africa (excluding high income)Middle East & North Africa (IDA & IBRD countries)Middle incomeMoldovaMongoliaMontenegroMoroccoMozambiqueMyanmarNamibiaNepalNetherlandsNew ZealandNicaraguaNigerNigeriaNorth AmericaNorwayOECD membersOmanOther small statesPakistanPanamaParaguayPeruPhilippinesPolandPortugalPost-demographic dividendPre-demographic dividendQatarRomaniaRussian FederationSaudi ArabiaSenegalSerbiaSingaporeSlovak RepublicSloveniaSmall statesSouth AfricaSouth AsiaSouth Asia (IDA & IBRD)South SudanSpainSri LankaSub-Saharan Africa Sub-Saharan Africa (excluding high income)Sub-Saharan Africa (IDA & IBRD countries)SudanSwedenSwitzerlandSyrian Arab RepublicTajikistanTanzaniaThailandTogoTrinidad and TobagoTunisiaTurkeyTurkmenistanUkraineUnited Arab EmiratesUnited KingdomUnited StatesUpper middle incomeUruguayUzbekistanVenezuela, RBVietnamWorldYemen, Rep.ZambiaZimbabwe Timeline:
This timeline shows a graph from 1972 to 2014 of Paraguay. No data until 1971. Number of actual observations by date: 43.
Source name:
World Development Indicators
Source organization:
IEA Statistics © OECD/IEA 2014 (http://www.iea.org/stats/index.asp), subject to https://www.iea.org/t&c/termsandconditions/
Categories, topics:
Environment
Last updated:
apr 23, 2017
Indicators value changes by year
Maximum:
14.286
jan 1, 1973
At the date of observation
Value
Absolute change
Change from previous value
jan 1, 1972
12.281
+12.281
0.0%
jan 1, 1973
14.286
+2.005
16.33%
jan 1, 1974
12.857
-1.429
-10.0%
jan 1, 1975
11.94
-0.917
-7.13%
jan 1, 1976
12.857
+0.917
7.68%
jan 1, 1977
12.821
-0.037
-0.28%
jan 1, 1978
8.929
-3.892
-30.36%
jan 1, 1979
7.143
-1.786
-20.0%
jan 1, 1980
7.407
+0.265
3.7%
jan 1, 1981
5.926
-1.481
-20.0%
jan 1, 1982
6.87
+0.944
15.94%
jan 1, 1983
9.924
+3.053
44.44%
jan 1, 1984
8.8
-1.124
-11.32%
jan 1, 1985
7.143
-1.657
-18.83%
jan 1, 1986
5.634
-1.509
-21.13%
jan 1, 1987
6.122
+0.489
8.67%
jan 1, 1988
6.211
+0.089
1.45%
jan 1, 1989
7.609
+1.398
22.5%
jan 1, 1990
6.557
-1.051
-13.82%
jan 1, 1991
7.772
+1.215
18.52%
jan 1, 1992
10.106
+2.334
30.04%
jan 1, 1993
11.111
+1.005
9.94%
jan 1, 1994
5.364
-5.747
-51.72%
jan 1, 1995
10.749
+5.385
100.4%
jan 1, 1996
7.45
-3.299
-30.69%
jan 1, 1997
8.116
+0.666
8.94%
jan 1, 1998
7.572
-0.544
-6.7%
jan 1, 1999
7.463
-0.109
-1.44%
jan 1, 2000
6.948
-0.515
-6.9%
jan 1, 2001
7.927
+0.979
14.09%
jan 1, 2002
7.038
-0.889
-11.21%
jan 1, 2003
6.685
-0.353
-5.01%
jan 1, 2004
4.313
-2.373
-35.49%
jan 1, 2005
5.319
+1.006
23.34%
jan 1, 2006
6.628
+1.309
24.61%
jan 1, 2007
5.0
-1.628
-24.57%
jan 1, 2008
2.145
-2.855
-57.1%
jan 1, 2009
2.538
+0.393
18.34%
jan 1, 2010
2.195
-0.343
-13.51%
jan 1, 2011
3.433
+1.238
56.41%
jan 1, 2012
2.875
-0.559
-16.27%
jan 1, 2013
5.159
+2.284
79.45%
jan 1, 2014
2.434
-2.725
-52.82%
Ranking of countries by current statistics by years


Comments: