29
/
en
AIzaSyAYiBZKx7MnpbEhh9jyipgxe19OcubqV5w
April 1, 2024
139069
Germany
DEU
true
2
1
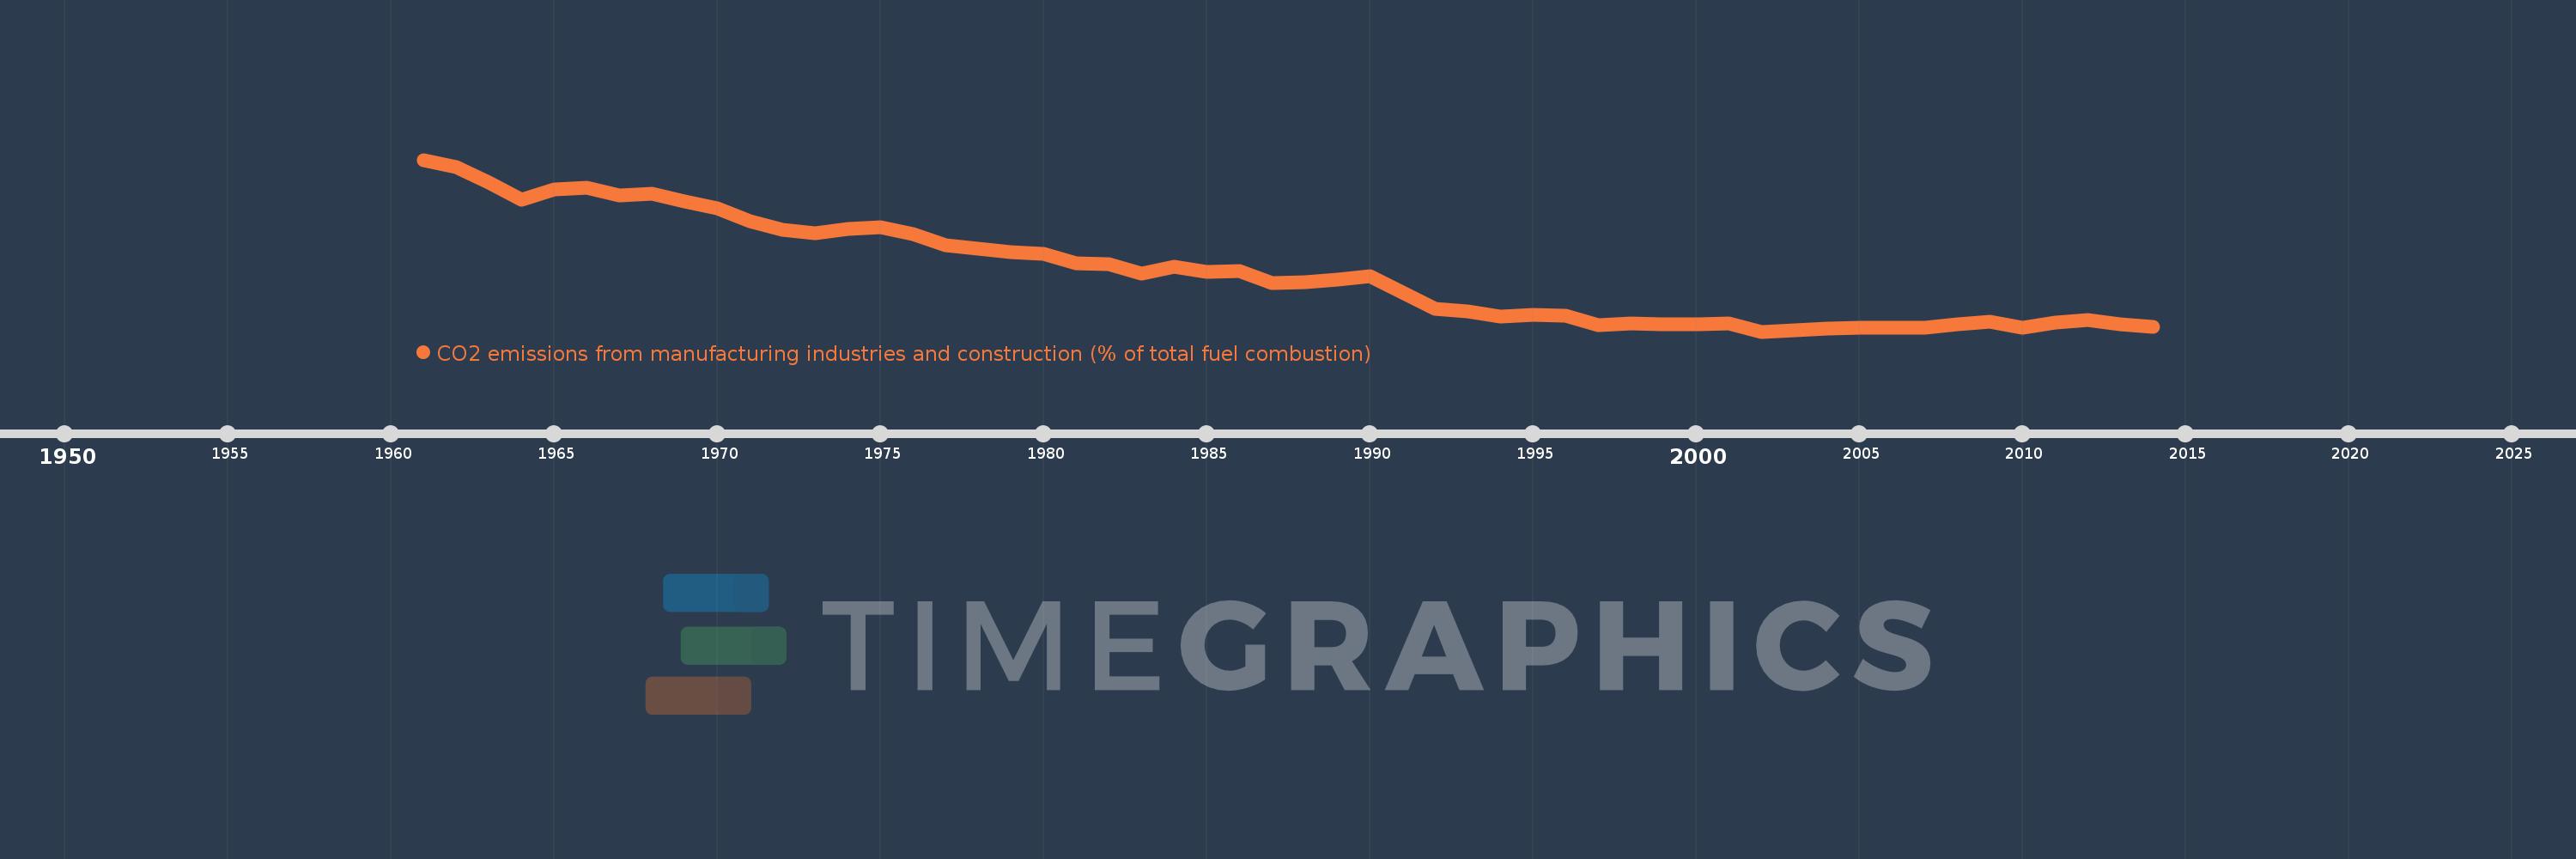
CO2 emissions from manufacturing industries and construction (% of total fuel combustion)
2014,2013,2012,2011,2010,2009,2008,2007,2006,2005,2004,2003,2002,2001,2000,1999,1998,1997,1996,1995,1994,1993,1992,1991,1990,1989,1988,1987,1986,1985,1984,1983,1982,1981,1980,1979,1978,1977,1976,1975,1974,1973,1972,1971,1970,1969,1968,1967,1966,1965,1964,1963,1962,1961
This statistics in other country:
AlbaniaAlgeriaAngolaArab WorldArgentinaArmeniaAustraliaAustriaAzerbaijanBahrainBangladeshBelarusBelgiumBeninBoliviaBosnia and HerzegovinaBotswanaBrazilBrunei DarussalamBulgariaCambodiaCameroonCanadaCaribbean small statesCentral Europe and the BalticsChileChinaColombiaCongo, Dem. Rep.Congo, Rep.Costa RicaCote d'IvoireCroatiaCubaCuracaoCyprusCzech RepublicDenmarkDominican RepublicEarly-demographic dividendEast Asia & PacificEast Asia & Pacific (excluding high income)East Asia & Pacific (IDA & IBRD countries)EcuadorEgypt, Arab Rep.El SalvadorEritreaEstoniaEthiopiaEuro areaEurope & Central AsiaEurope & Central Asia (excluding high income)Europe & Central Asia (IDA & IBRD countries)European UnionFinlandFragile and conflict affected situationsFranceGabonGeorgiaGermanyGhanaGibraltarGreeceGuatemalaHaitiHeavily indebted poor countries (HIPC)High incomeHondurasHong Kong SAR, ChinaHungaryIBRD onlyIcelandIDA & IBRD totalIDA blendIDA onlyIDA totalIndiaIndonesiaIran, Islamic Rep.IraqIrelandIsraelItalyJamaicaJapanJordanKazakhstanKenyaKorea, Dem. People’s Rep.Korea, Rep.KosovoKuwaitKyrgyz RepublicLate-demographic dividendLatin America & Caribbean Latin America & Caribbean (excluding high income)Latin America & the Caribbean (IDA & IBRD countries)LatviaLeast developed countries: UN classificationLebanonLibyaLithuaniaLow & middle incomeLow incomeLower middle incomeLuxembourgMacedonia, FYRMalaysiaMaltaMauritiusMexicoMiddle East & North AfricaMiddle East & North Africa (excluding high income)Middle East & North Africa (IDA & IBRD countries)Middle incomeMoldovaMongoliaMontenegroMoroccoMozambiqueMyanmarNamibiaNepalNetherlandsNew ZealandNicaraguaNigerNigeriaNorth AmericaNorwayOECD membersOmanOther small statesPakistanPanamaParaguayPeruPhilippinesPolandPortugalPost-demographic dividendPre-demographic dividendQatarRomaniaRussian FederationSaudi ArabiaSenegalSerbiaSingaporeSlovak RepublicSloveniaSmall statesSouth AfricaSouth AsiaSouth Asia (IDA & IBRD)South SudanSpainSri LankaSub-Saharan Africa Sub-Saharan Africa (excluding high income)Sub-Saharan Africa (IDA & IBRD countries)SudanSwedenSwitzerlandSyrian Arab RepublicTajikistanTanzaniaThailandTogoTrinidad and TobagoTunisiaTurkeyTurkmenistanUkraineUnited Arab EmiratesUnited KingdomUnited StatesUpper middle incomeUruguayUzbekistanVenezuela, RBVietnamWorldYemen, Rep.ZambiaZimbabwe Timeline:
This timeline shows a graph from 1961 to 2014 of Germany. No data until 1960. Number of actual observations by date: 54.
Source name:
World Development Indicators
Source organization:
IEA Statistics © OECD/IEA 2014 (http://www.iea.org/stats/index.asp), subject to https://www.iea.org/t&c/termsandconditions/
Categories, topics:
Environment
Last updated:
apr 23, 2017
Indicators value changes by year
Minimum:
11.592
jan 1, 2002
Maximum:
33.562
jan 1, 1961
At the date of observation
Value
Absolute change
Change from previous value
jan 1, 1961
33.562
+33.562
0.0%
jan 1, 1962
32.59
-0.972
-2.89%
jan 1, 1963
30.6
-1.99
-6.11%
jan 1, 1964
28.469
-2.132
-6.97%
jan 1, 1965
29.818
+1.349
4.74%
jan 1, 1966
30.018
+0.201
0.67%
jan 1, 1967
29.036
-0.982
-3.27%
jan 1, 1968
29.228
+0.192
0.66%
jan 1, 1969
28.21
-1.018
-3.48%
jan 1, 1970
27.348
-0.863
-3.06%
jan 1, 1971
25.677
-1.67
-6.11%
jan 1, 1972
24.639
-1.038
-4.04%
jan 1, 1973
24.169
-0.471
-1.91%
jan 1, 1974
24.737
+0.568
2.35%
jan 1, 1975
24.95
+0.213
0.86%
jan 1, 1976
24.04
-0.909
-3.64%
jan 1, 1977
22.589
-1.451
-6.04%
jan 1, 1978
22.186
-0.403
-1.78%
jan 1, 1979
21.768
-0.418
-1.88%
jan 1, 1980
21.508
-0.261
-1.2%
jan 1, 1981
20.317
-1.19
-5.53%
jan 1, 1982
20.203
-0.114
-0.56%
jan 1, 1983
19.061
-1.142
-5.65%
jan 1, 1984
19.832
+0.771
4.05%
jan 1, 1985
19.213
-0.62
-3.12%
jan 1, 1986
19.342
+0.13
0.68%
jan 1, 1987
17.824
-1.519
-7.85%
jan 1, 1988
17.863
+0.039
0.22%
jan 1, 1989
18.24
+0.377
2.11%
jan 1, 1990
18.684
+0.444
2.44%
jan 1, 1991
16.606
-2.078
-11.12%
jan 1, 1992
14.554
-2.052
-12.36%
jan 1, 1993
14.211
-0.343
-2.35%
jan 1, 1994
13.475
-0.736
-5.18%
jan 1, 1995
13.721
+0.245
1.82%
jan 1, 1996
13.609
-0.111
-0.81%
jan 1, 1997
12.452
-1.157
-8.5%
jan 1, 1998
12.65
+0.198
1.59%
jan 1, 1999
12.509
-0.142
-1.12%
jan 1, 2000
12.471
-0.038
-0.3%
jan 1, 2001
12.641
+0.17
1.37%
jan 1, 2002
11.592
-1.049
-8.3%
jan 1, 2003
11.712
+0.12
1.04%
jan 1, 2004
12.005
+0.293
2.5%
jan 1, 2005
12.057
+0.052
0.44%
jan 1, 2006
12.039
-0.018
-0.15%
jan 1, 2007
12.088
+0.048
0.4%
jan 1, 2008
12.522
+0.434
3.59%
jan 1, 2009
12.873
+0.351
2.8%
jan 1, 2010
12.052
-0.82
-6.37%
jan 1, 2011
12.79
+0.737
6.12%
jan 1, 2012
13.117
+0.327
2.56%
jan 1, 2013
12.481
-0.636
-4.85%
jan 1, 2014
12.204
-0.277
-2.22%
Ranking of countries by current statistics by years


Comments: