29
/
en
AIzaSyAYiBZKx7MnpbEhh9jyipgxe19OcubqV5w
April 1, 2024
124574
Egypt, Arab Rep.
EGY
true
2
1
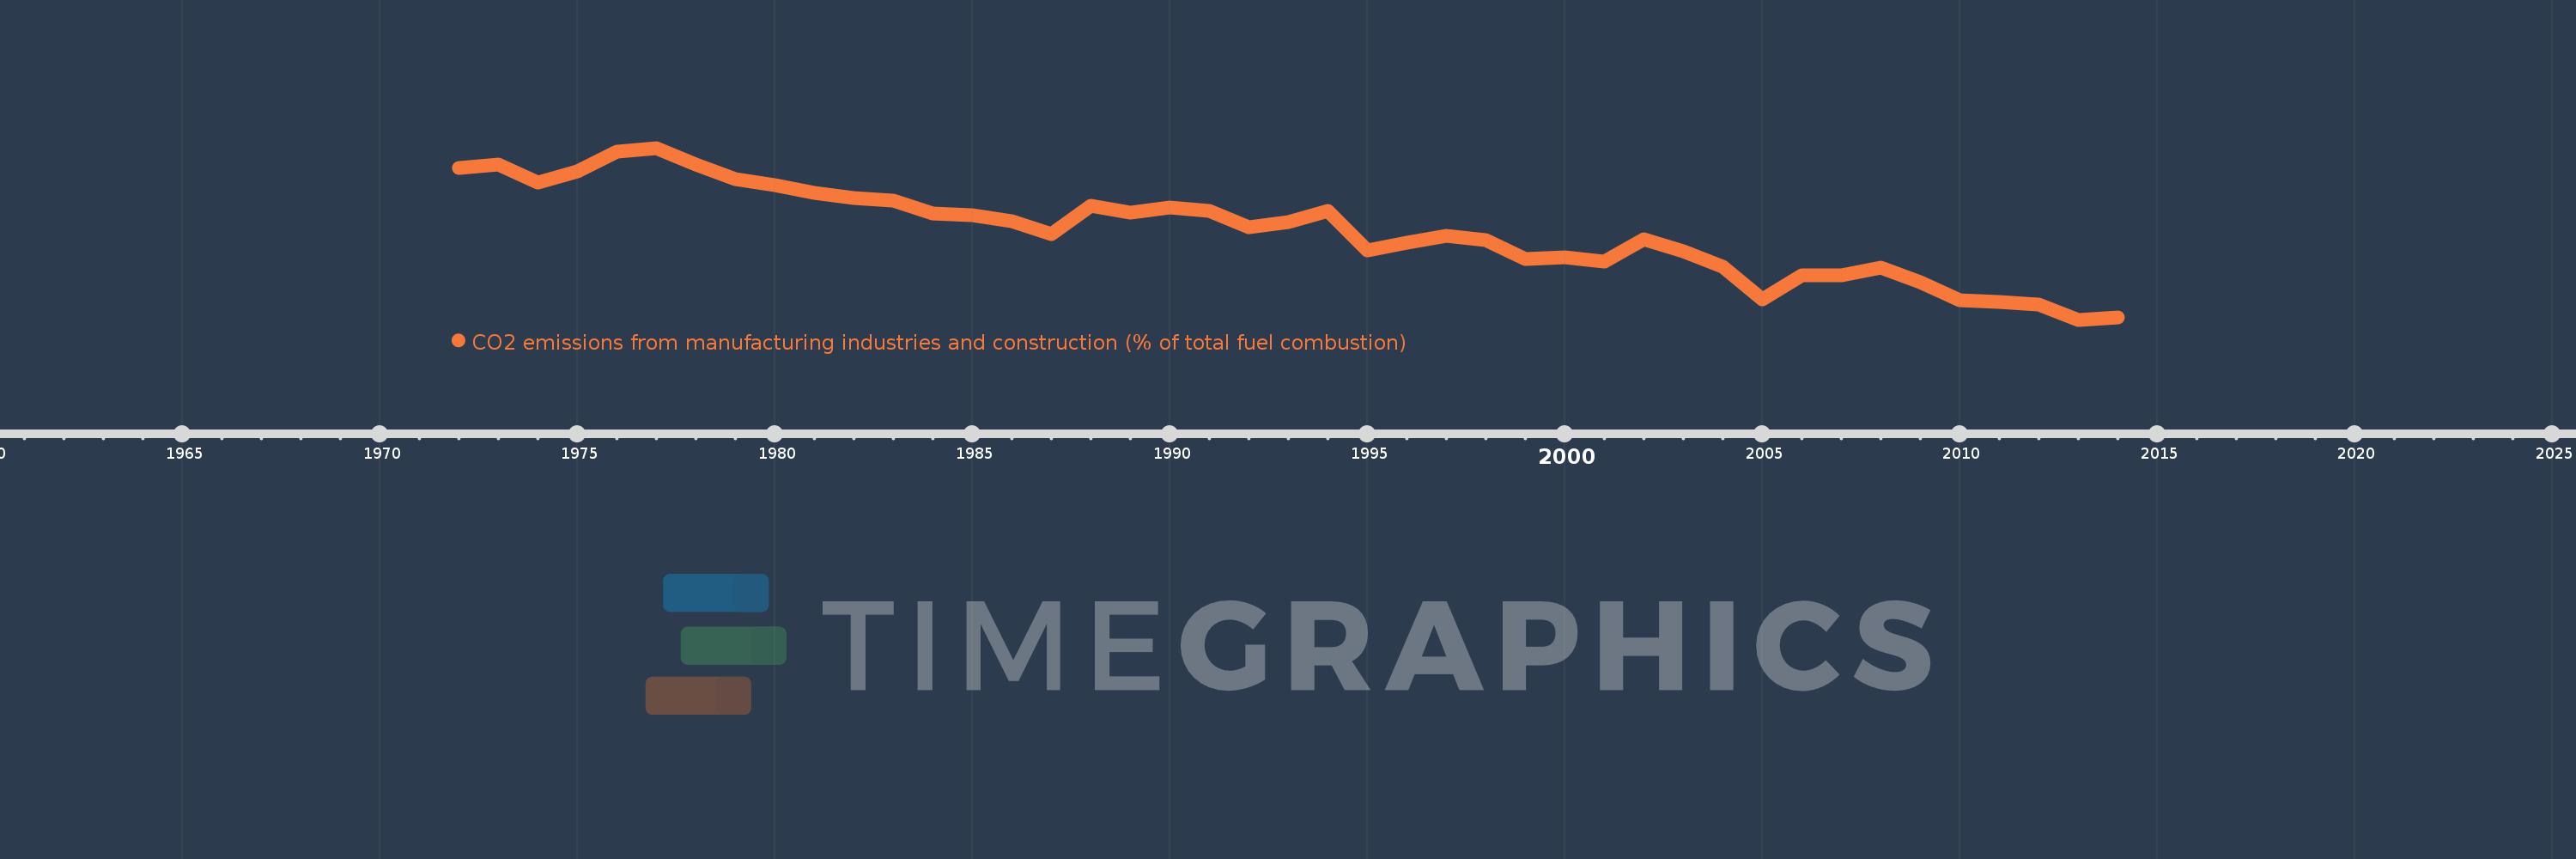
CO2 emissions from manufacturing industries and construction (% of total fuel combustion)
2014,2013,2012,2011,2010,2009,2008,2007,2006,2005,2004,2003,2002,2001,2000,1999,1998,1997,1996,1995,1994,1993,1992,1991,1990,1989,1988,1987,1986,1985,1984,1983,1982,1981,1980,1979,1978,1977,1976,1975,1974,1973,1972
This statistics in other country:
AlbaniaAlgeriaAngolaArab WorldArgentinaArmeniaAustraliaAustriaAzerbaijanBahrainBangladeshBelarusBelgiumBeninBoliviaBosnia and HerzegovinaBotswanaBrazilBrunei DarussalamBulgariaCambodiaCameroonCanadaCaribbean small statesCentral Europe and the BalticsChileChinaColombiaCongo, Dem. Rep.Congo, Rep.Costa RicaCote d'IvoireCroatiaCubaCuracaoCyprusCzech RepublicDenmarkDominican RepublicEarly-demographic dividendEast Asia & PacificEast Asia & Pacific (excluding high income)East Asia & Pacific (IDA & IBRD countries)EcuadorEgypt, Arab Rep.El SalvadorEritreaEstoniaEthiopiaEuro areaEurope & Central AsiaEurope & Central Asia (excluding high income)Europe & Central Asia (IDA & IBRD countries)European UnionFinlandFragile and conflict affected situationsFranceGabonGeorgiaGermanyGhanaGibraltarGreeceGuatemalaHaitiHeavily indebted poor countries (HIPC)High incomeHondurasHong Kong SAR, ChinaHungaryIBRD onlyIcelandIDA & IBRD totalIDA blendIDA onlyIDA totalIndiaIndonesiaIran, Islamic Rep.IraqIrelandIsraelItalyJamaicaJapanJordanKazakhstanKenyaKorea, Dem. People’s Rep.Korea, Rep.KosovoKuwaitKyrgyz RepublicLate-demographic dividendLatin America & Caribbean Latin America & Caribbean (excluding high income)Latin America & the Caribbean (IDA & IBRD countries)LatviaLeast developed countries: UN classificationLebanonLibyaLithuaniaLow & middle incomeLow incomeLower middle incomeLuxembourgMacedonia, FYRMalaysiaMaltaMauritiusMexicoMiddle East & North AfricaMiddle East & North Africa (excluding high income)Middle East & North Africa (IDA & IBRD countries)Middle incomeMoldovaMongoliaMontenegroMoroccoMozambiqueMyanmarNamibiaNepalNetherlandsNew ZealandNicaraguaNigerNigeriaNorth AmericaNorwayOECD membersOmanOther small statesPakistanPanamaParaguayPeruPhilippinesPolandPortugalPost-demographic dividendPre-demographic dividendQatarRomaniaRussian FederationSaudi ArabiaSenegalSerbiaSingaporeSlovak RepublicSloveniaSmall statesSouth AfricaSouth AsiaSouth Asia (IDA & IBRD)South SudanSpainSri LankaSub-Saharan Africa Sub-Saharan Africa (excluding high income)Sub-Saharan Africa (IDA & IBRD countries)SudanSwedenSwitzerlandSyrian Arab RepublicTajikistanTanzaniaThailandTogoTrinidad and TobagoTunisiaTurkeyTurkmenistanUkraineUnited Arab EmiratesUnited KingdomUnited StatesUpper middle incomeUruguayUzbekistanVenezuela, RBVietnamWorldYemen, Rep.ZambiaZimbabwe Timeline:
This timeline shows a graph from 1972 to 2014 of Egypt, Arab Rep.. No data until 1971. Number of actual observations by date: 43.
Source name:
World Development Indicators
Source organization:
IEA Statistics © OECD/IEA 2014 (http://www.iea.org/stats/index.asp), subject to https://www.iea.org/t&c/termsandconditions/
Categories, topics:
Environment
Last updated:
apr 23, 2017
Indicators value changes by year
Maximum:
45.576
jan 1, 1977
At the date of observation
Value
Absolute change
Change from previous value
jan 1, 1972
42.016
+42.016
0.0%
jan 1, 1973
42.521
+0.505
1.2%
jan 1, 1974
39.343
-3.178
-7.47%
jan 1, 1975
41.418
+2.075
5.27%
jan 1, 1976
44.975
+3.557
8.59%
jan 1, 1977
45.576
+0.602
1.34%
jan 1, 1978
42.513
-3.063
-6.72%
jan 1, 1979
39.982
-2.532
-5.95%
jan 1, 1980
38.883
-1.099
-2.75%
jan 1, 1981
37.417
-1.466
-3.77%
jan 1, 1982
36.516
-0.901
-2.41%
jan 1, 1983
36.095
-0.421
-1.15%
jan 1, 1984
33.772
-2.323
-6.44%
jan 1, 1985
33.501
-0.271
-0.8%
jan 1, 1986
32.413
-1.088
-3.25%
jan 1, 1987
30.014
-2.399
-7.4%
jan 1, 1988
35.104
+5.09
16.96%
jan 1, 1989
33.944
-1.16
-3.3%
jan 1, 1990
34.873
+0.929
2.74%
jan 1, 1991
34.151
-0.722
-2.07%
jan 1, 1992
31.296
-2.855
-8.36%
jan 1, 1993
32.209
+0.913
2.92%
jan 1, 1994
34.258
+2.048
6.36%
jan 1, 1995
27.01
-7.248
-21.16%
jan 1, 1996
28.402
+1.392
5.15%
jan 1, 1997
29.643
+1.241
4.37%
jan 1, 1998
28.969
-0.673
-2.27%
jan 1, 1999
25.482
-3.487
-12.04%
jan 1, 2000
25.889
+0.407
1.6%
jan 1, 2001
24.992
-0.897
-3.46%
jan 1, 2002
29.164
+4.172
16.69%
jan 1, 2003
26.965
-2.199
-7.54%
jan 1, 2004
24.093
-2.872
-10.65%
jan 1, 2005
18.225
-5.868
-24.36%
jan 1, 2006
22.639
+4.414
24.22%
jan 1, 2007
22.56
-0.079
-0.35%
jan 1, 2008
23.985
+1.425
6.32%
jan 1, 2009
21.305
-2.68
-11.17%
jan 1, 2010
18.093
-3.212
-15.08%
jan 1, 2011
17.744
-0.349
-1.93%
jan 1, 2012
17.357
-0.387
-2.18%
jan 1, 2013
14.56
-2.797
-16.11%
jan 1, 2014
14.963
+0.403
2.77%
Ranking of countries by current statistics by years


Comments: