29
/
en
AIzaSyAYiBZKx7MnpbEhh9jyipgxe19OcubqV5w
April 1, 2024
105762
China
CHN
true
2
1
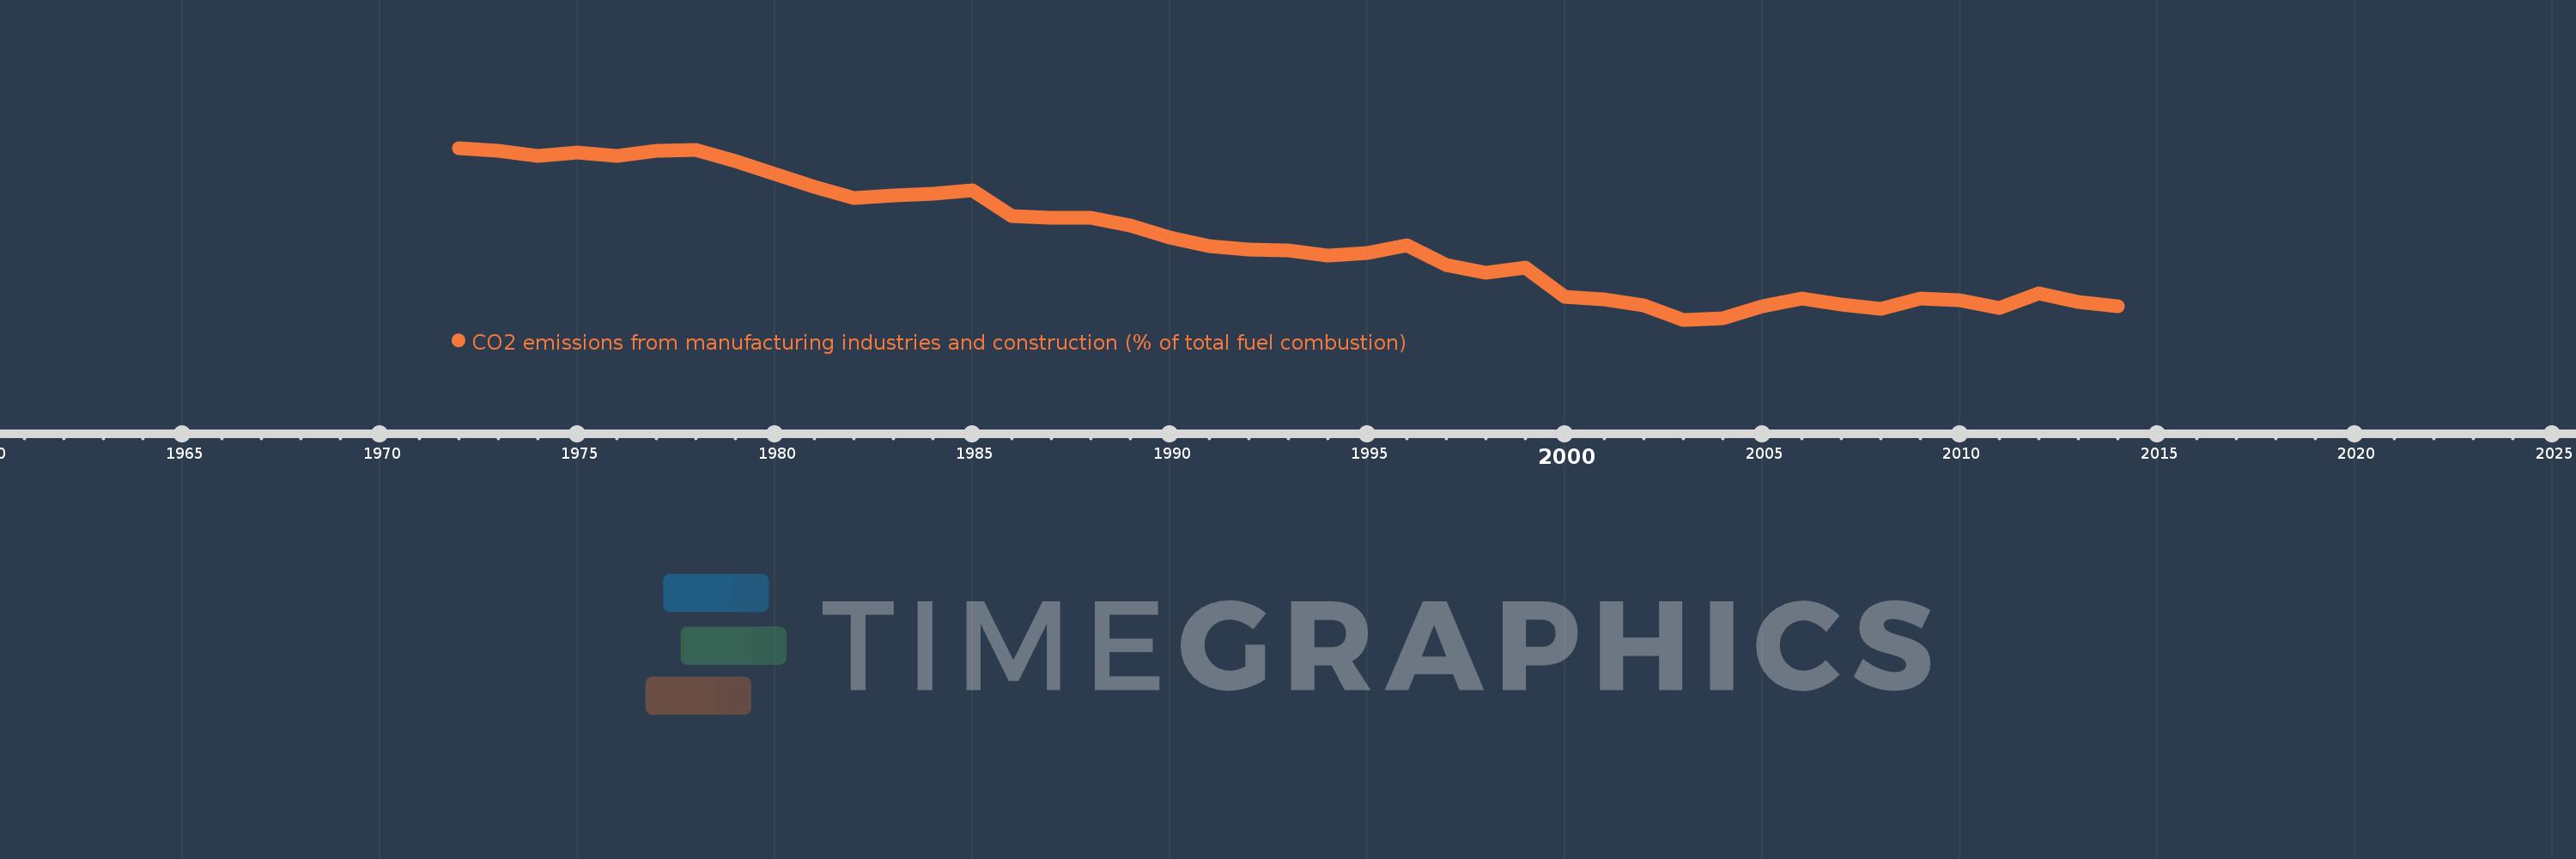
CO2 emissions from manufacturing industries and construction (% of total fuel combustion)
2014,2013,2012,2011,2010,2009,2008,2007,2006,2005,2004,2003,2002,2001,2000,1999,1998,1997,1996,1995,1994,1993,1992,1991,1990,1989,1988,1987,1986,1985,1984,1983,1982,1981,1980,1979,1978,1977,1976,1975,1974,1973,1972
This statistics in other country:
AlbaniaAlgeriaAngolaArab WorldArgentinaArmeniaAustraliaAustriaAzerbaijanBahrainBangladeshBelarusBelgiumBeninBoliviaBosnia and HerzegovinaBotswanaBrazilBrunei DarussalamBulgariaCambodiaCameroonCanadaCaribbean small statesCentral Europe and the BalticsChileChinaColombiaCongo, Dem. Rep.Congo, Rep.Costa RicaCote d'IvoireCroatiaCubaCuracaoCyprusCzech RepublicDenmarkDominican RepublicEarly-demographic dividendEast Asia & PacificEast Asia & Pacific (excluding high income)East Asia & Pacific (IDA & IBRD countries)EcuadorEgypt, Arab Rep.El SalvadorEritreaEstoniaEthiopiaEuro areaEurope & Central AsiaEurope & Central Asia (excluding high income)Europe & Central Asia (IDA & IBRD countries)European UnionFinlandFragile and conflict affected situationsFranceGabonGeorgiaGermanyGhanaGibraltarGreeceGuatemalaHaitiHeavily indebted poor countries (HIPC)High incomeHondurasHong Kong SAR, ChinaHungaryIBRD onlyIcelandIDA & IBRD totalIDA blendIDA onlyIDA totalIndiaIndonesiaIran, Islamic Rep.IraqIrelandIsraelItalyJamaicaJapanJordanKazakhstanKenyaKorea, Dem. People’s Rep.Korea, Rep.KosovoKuwaitKyrgyz RepublicLate-demographic dividendLatin America & Caribbean Latin America & Caribbean (excluding high income)Latin America & the Caribbean (IDA & IBRD countries)LatviaLeast developed countries: UN classificationLebanonLibyaLithuaniaLow & middle incomeLow incomeLower middle incomeLuxembourgMacedonia, FYRMalaysiaMaltaMauritiusMexicoMiddle East & North AfricaMiddle East & North Africa (excluding high income)Middle East & North Africa (IDA & IBRD countries)Middle incomeMoldovaMongoliaMontenegroMoroccoMozambiqueMyanmarNamibiaNepalNetherlandsNew ZealandNicaraguaNigerNigeriaNorth AmericaNorwayOECD membersOmanOther small statesPakistanPanamaParaguayPeruPhilippinesPolandPortugalPost-demographic dividendPre-demographic dividendQatarRomaniaRussian FederationSaudi ArabiaSenegalSerbiaSingaporeSlovak RepublicSloveniaSmall statesSouth AfricaSouth AsiaSouth Asia (IDA & IBRD)South SudanSpainSri LankaSub-Saharan Africa Sub-Saharan Africa (excluding high income)Sub-Saharan Africa (IDA & IBRD countries)SudanSwedenSwitzerlandSyrian Arab RepublicTajikistanTanzaniaThailandTogoTrinidad and TobagoTunisiaTurkeyTurkmenistanUkraineUnited Arab EmiratesUnited KingdomUnited StatesUpper middle incomeUruguayUzbekistanVenezuela, RBVietnamWorldYemen, Rep.ZambiaZimbabwe Timeline:
This timeline shows a graph from 1972 to 2014 of China. No data until 1971. Number of actual observations by date: 43.
Source name:
World Development Indicators
Source organization:
IEA Statistics © OECD/IEA 2014 (http://www.iea.org/stats/index.asp), subject to https://www.iea.org/t&c/termsandconditions/
Categories, topics:
Environment
Last updated:
apr 23, 2017
Indicators value changes by year
Minimum:
29.498
jan 1, 2003
Maximum:
51.896
jan 1, 1972
At the date of observation
Value
Absolute change
Change from previous value
jan 1, 1972
51.896
+51.896
0.0%
jan 1, 1973
51.501
-0.395
-0.76%
jan 1, 1974
50.861
-0.64
-1.24%
jan 1, 1975
51.33
+0.469
0.92%
jan 1, 1976
50.828
-0.502
-0.98%
jan 1, 1977
51.544
+0.715
1.41%
jan 1, 1978
51.662
+0.119
0.23%
jan 1, 1979
50.152
-1.51
-2.92%
jan 1, 1980
48.543
-1.609
-3.21%
jan 1, 1981
46.866
-1.677
-3.45%
jan 1, 1982
45.378
-1.488
-3.18%
jan 1, 1983
45.754
+0.376
0.83%
jan 1, 1984
45.939
+0.185
0.4%
jan 1, 1985
46.344
+0.406
0.88%
jan 1, 1986
42.968
-3.376
-7.28%
jan 1, 1987
42.828
-0.14
-0.33%
jan 1, 1988
42.774
-0.054
-0.13%
jan 1, 1989
41.789
-0.985
-2.3%
jan 1, 1990
40.262
-1.528
-3.66%
jan 1, 1991
39.051
-1.21
-3.01%
jan 1, 1992
38.644
-0.408
-1.04%
jan 1, 1993
38.543
-0.101
-0.26%
jan 1, 1994
37.808
-0.734
-1.91%
jan 1, 1995
38.162
+0.354
0.94%
jan 1, 1996
39.187
+1.024
2.68%
jan 1, 1997
36.661
-2.525
-6.44%
jan 1, 1998
35.571
-1.09
-2.97%
jan 1, 1999
36.258
+0.687
1.93%
jan 1, 2000
32.466
-3.793
-10.46%
jan 1, 2001
32.178
-0.287
-0.89%
jan 1, 2002
31.336
-0.842
-2.62%
jan 1, 2003
29.498
-1.838
-5.86%
jan 1, 2004
29.696
+0.198
0.67%
jan 1, 2005
31.257
+1.561
5.26%
jan 1, 2006
32.288
+1.03
3.3%
jan 1, 2007
31.526
-0.762
-2.36%
jan 1, 2008
30.916
-0.609
-1.93%
jan 1, 2009
32.279
+1.362
4.41%
jan 1, 2010
32.047
-0.232
-0.72%
jan 1, 2011
31.038
-1.008
-3.15%
jan 1, 2012
32.964
+1.926
6.21%
jan 1, 2013
31.86
-1.105
-3.35%
jan 1, 2014
31.255
-0.605
-1.9%
Ranking of countries by current statistics by years


Comments: