29
/
en
AIzaSyAYiBZKx7MnpbEhh9jyipgxe19OcubqV5w
April 1, 2024
198865
Mongolia
MNG
true
2
1
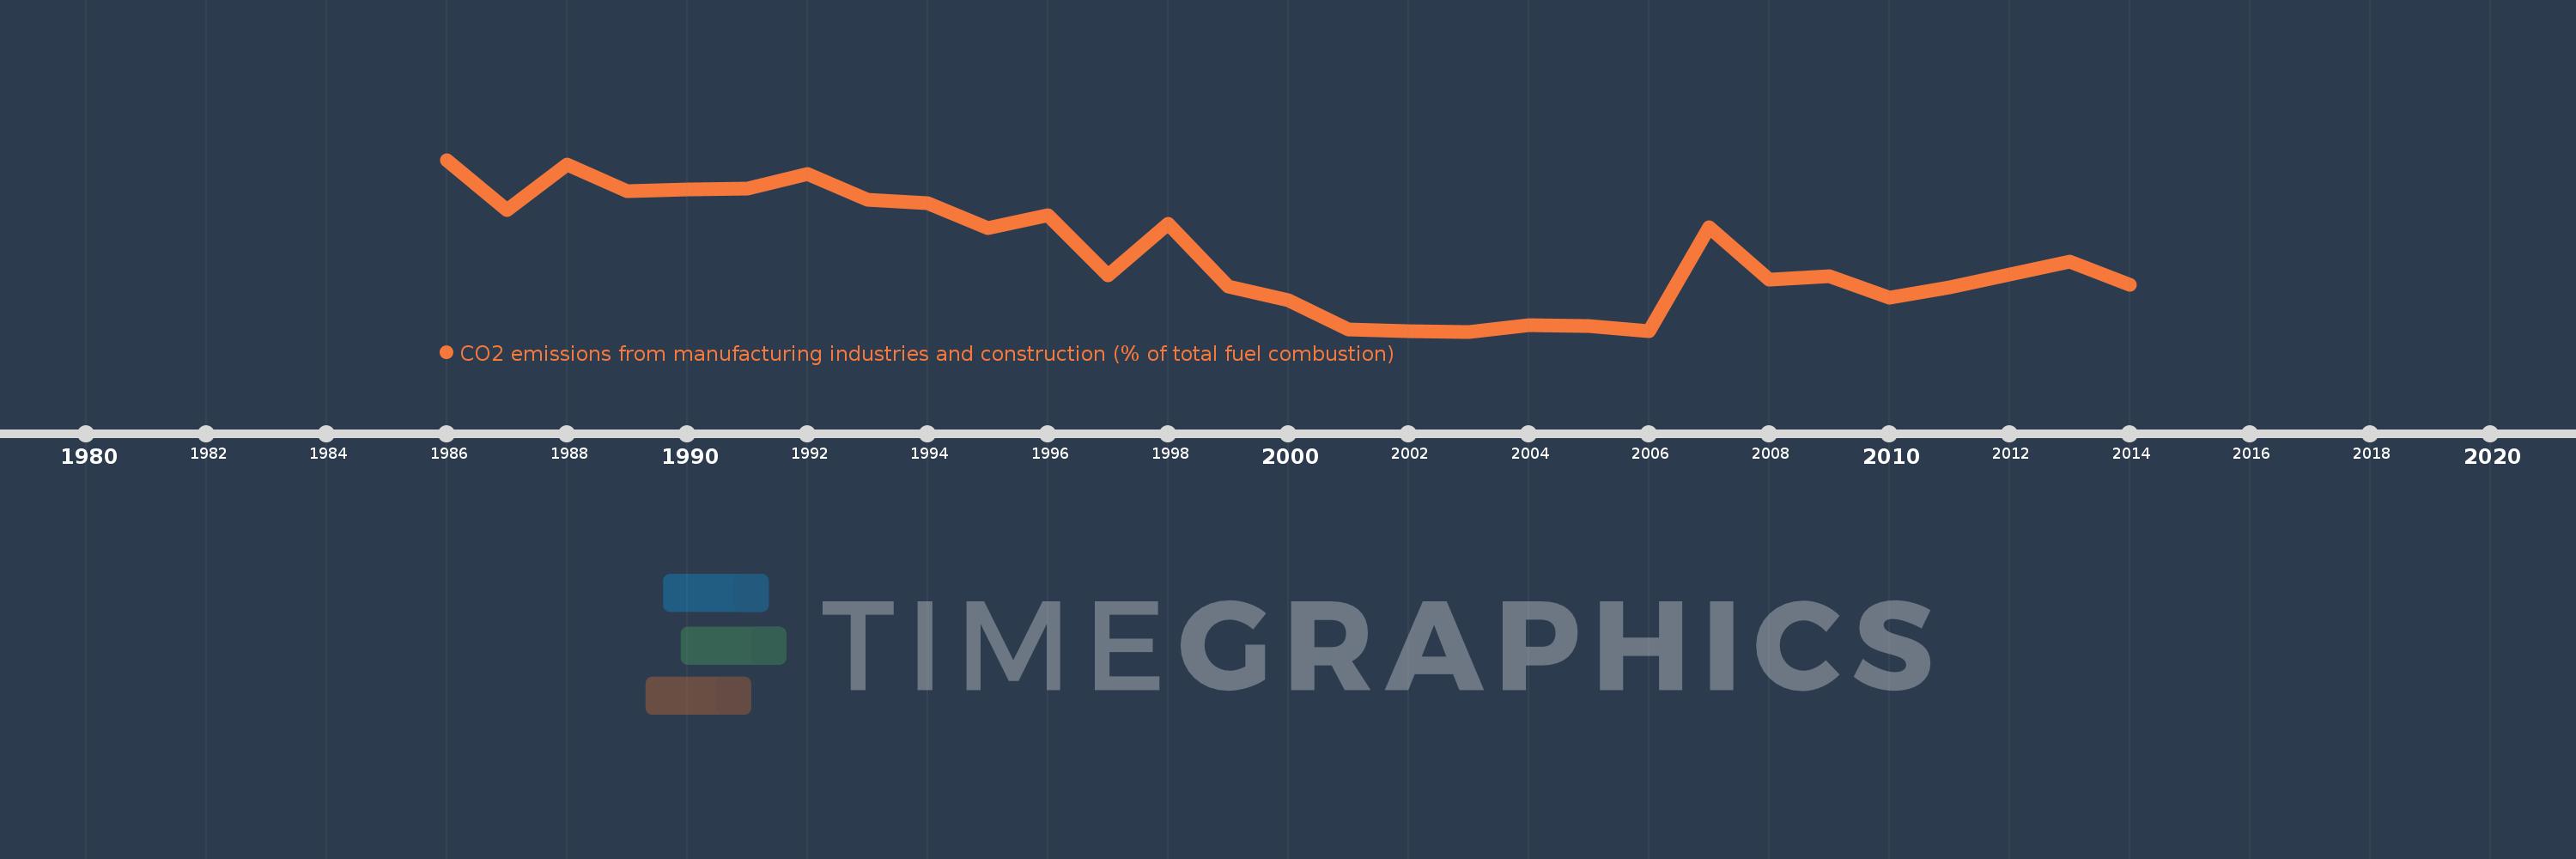
CO2 emissions from manufacturing industries and construction (% of total fuel combustion)
2014,2013,2012,2011,2010,2009,2008,2007,2006,2005,2004,2003,2002,2001,2000,1999,1998,1997,1996,1995,1994,1993,1992,1991,1990,1989,1988,1987,1986
This statistics in other country:
AlbaniaAlgeriaAngolaArab WorldArgentinaArmeniaAustraliaAustriaAzerbaijanBahrainBangladeshBelarusBelgiumBeninBoliviaBosnia and HerzegovinaBotswanaBrazilBrunei DarussalamBulgariaCambodiaCameroonCanadaCaribbean small statesCentral Europe and the BalticsChileChinaColombiaCongo, Dem. Rep.Congo, Rep.Costa RicaCote d'IvoireCroatiaCubaCuracaoCyprusCzech RepublicDenmarkDominican RepublicEarly-demographic dividendEast Asia & PacificEast Asia & Pacific (excluding high income)East Asia & Pacific (IDA & IBRD countries)EcuadorEgypt, Arab Rep.El SalvadorEritreaEstoniaEthiopiaEuro areaEurope & Central AsiaEurope & Central Asia (excluding high income)Europe & Central Asia (IDA & IBRD countries)European UnionFinlandFragile and conflict affected situationsFranceGabonGeorgiaGermanyGhanaGibraltarGreeceGuatemalaHaitiHeavily indebted poor countries (HIPC)High incomeHondurasHong Kong SAR, ChinaHungaryIBRD onlyIcelandIDA & IBRD totalIDA blendIDA onlyIDA totalIndiaIndonesiaIran, Islamic Rep.IraqIrelandIsraelItalyJamaicaJapanJordanKazakhstanKenyaKorea, Dem. People’s Rep.Korea, Rep.KosovoKuwaitKyrgyz RepublicLate-demographic dividendLatin America & Caribbean Latin America & Caribbean (excluding high income)Latin America & the Caribbean (IDA & IBRD countries)LatviaLeast developed countries: UN classificationLebanonLibyaLithuaniaLow & middle incomeLow incomeLower middle incomeLuxembourgMacedonia, FYRMalaysiaMaltaMauritiusMexicoMiddle East & North AfricaMiddle East & North Africa (excluding high income)Middle East & North Africa (IDA & IBRD countries)Middle incomeMoldovaMongoliaMontenegroMoroccoMozambiqueMyanmarNamibiaNepalNetherlandsNew ZealandNicaraguaNigerNigeriaNorth AmericaNorwayOECD membersOmanOther small statesPakistanPanamaParaguayPeruPhilippinesPolandPortugalPost-demographic dividendPre-demographic dividendQatarRomaniaRussian FederationSaudi ArabiaSenegalSerbiaSingaporeSlovak RepublicSloveniaSmall statesSouth AfricaSouth AsiaSouth Asia (IDA & IBRD)South SudanSpainSri LankaSub-Saharan Africa Sub-Saharan Africa (excluding high income)Sub-Saharan Africa (IDA & IBRD countries)SudanSwedenSwitzerlandSyrian Arab RepublicTajikistanTanzaniaThailandTogoTrinidad and TobagoTunisiaTurkeyTurkmenistanUkraineUnited Arab EmiratesUnited KingdomUnited StatesUpper middle incomeUruguayUzbekistanVenezuela, RBVietnamWorldYemen, Rep.ZambiaZimbabwe Timeline:
This timeline shows a graph from 1986 to 2014 of Mongolia. No data until 1985. Number of actual observations by date: 29.
Source name:
World Development Indicators
Source organization:
IEA Statistics © OECD/IEA 2014 (http://www.iea.org/stats/index.asp), subject to https://www.iea.org/t&c/termsandconditions/
Categories, topics:
Environment
Last updated:
apr 23, 2017
Indicators value changes by year
Maximum:
24.873
jan 1, 1986
At the date of observation
Value
Absolute change
Change from previous value
jan 1, 1986
24.873
+24.873
0.0%
jan 1, 1987
19.609
-5.263
-21.16%
jan 1, 1988
24.336
+4.727
24.11%
jan 1, 1989
21.582
-2.754
-11.32%
jan 1, 1990
21.711
+0.128
0.59%
jan 1, 1991
21.851
+0.14
0.65%
jan 1, 1992
23.349
+1.499
6.86%
jan 1, 1993
20.671
-2.678
-11.47%
jan 1, 1994
20.27
-0.401
-1.94%
jan 1, 1995
17.67
-2.6
-12.83%
jan 1, 1996
19.024
+1.354
7.67%
jan 1, 1997
12.687
-6.337
-33.31%
jan 1, 1998
18.139
+5.452
42.97%
jan 1, 1999
11.502
-6.637
-36.59%
jan 1, 2000
10.14
-1.362
-11.85%
jan 1, 2001
7.016
-3.124
-30.81%
jan 1, 2002
6.808
-0.208
-2.96%
jan 1, 2003
6.799
-0.009
-0.13%
jan 1, 2004
7.443
+0.644
9.47%
jan 1, 2005
7.353
-0.09
-1.21%
jan 1, 2006
6.818
-0.535
-7.27%
jan 1, 2007
17.762
+10.943
160.5%
jan 1, 2008
12.307
-5.455
-30.71%
jan 1, 2009
12.597
+0.291
2.36%
jan 1, 2010
10.406
-2.191
-17.4%
jan 1, 2011
11.449
+1.043
10.02%
jan 1, 2012
12.765
+1.316
11.49%
jan 1, 2013
14.153
+1.388
10.87%
jan 1, 2014
11.736
-2.416
-17.07%
Ranking of countries by current statistics by years


Comments: