29
/
en
AIzaSyAYiBZKx7MnpbEhh9jyipgxe19OcubqV5w
April 1, 2024
123247
Ecuador
ECU
true
2
1
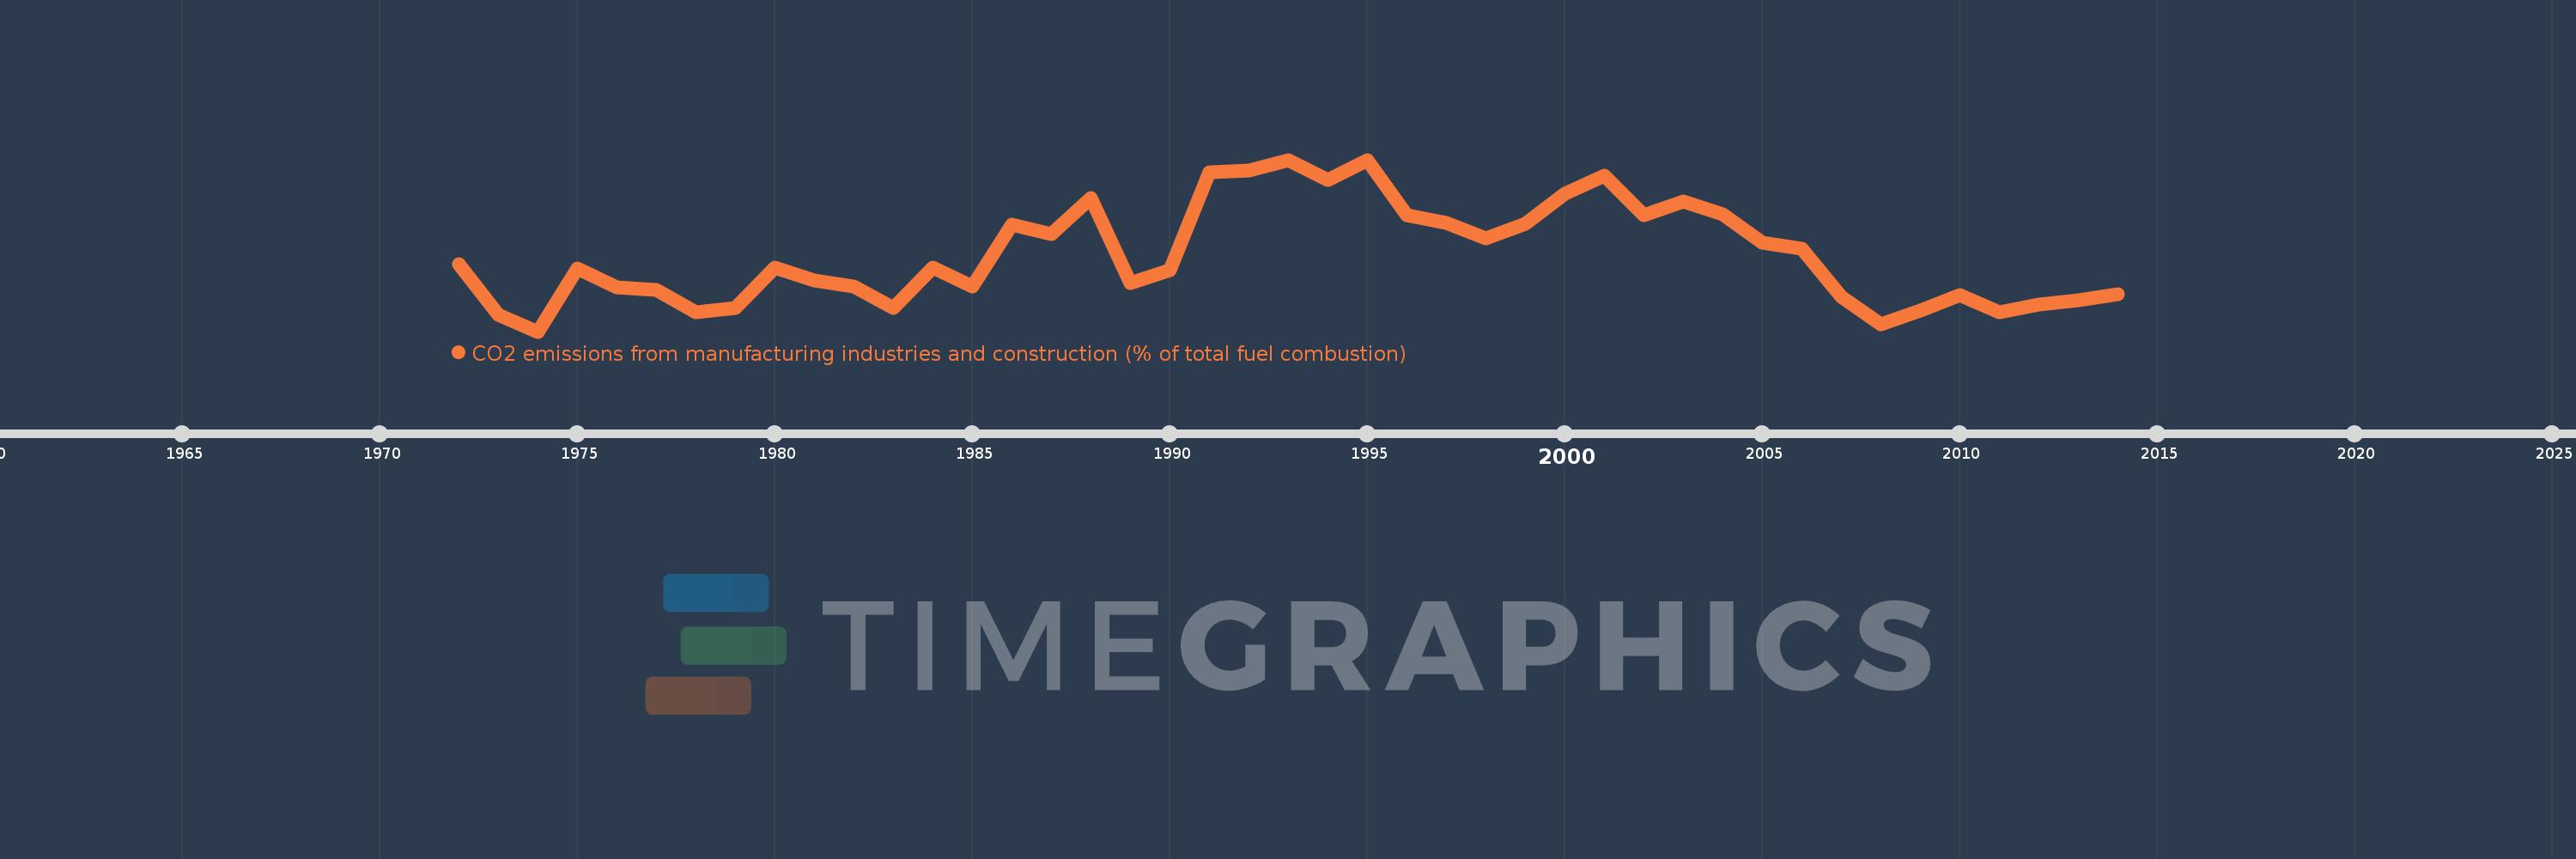
CO2 emissions from manufacturing industries and construction (% of total fuel combustion)
2014,2013,2012,2011,2010,2009,2008,2007,2006,2005,2004,2003,2002,2001,2000,1999,1998,1997,1996,1995,1994,1993,1992,1991,1990,1989,1988,1987,1986,1985,1984,1983,1982,1981,1980,1979,1978,1977,1976,1975,1974,1973,1972
This statistics in other country:
AlbaniaAlgeriaAngolaArab WorldArgentinaArmeniaAustraliaAustriaAzerbaijanBahrainBangladeshBelarusBelgiumBeninBoliviaBosnia and HerzegovinaBotswanaBrazilBrunei DarussalamBulgariaCambodiaCameroonCanadaCaribbean small statesCentral Europe and the BalticsChileChinaColombiaCongo, Dem. Rep.Congo, Rep.Costa RicaCote d'IvoireCroatiaCubaCuracaoCyprusCzech RepublicDenmarkDominican RepublicEarly-demographic dividendEast Asia & PacificEast Asia & Pacific (excluding high income)East Asia & Pacific (IDA & IBRD countries)EcuadorEgypt, Arab Rep.El SalvadorEritreaEstoniaEthiopiaEuro areaEurope & Central AsiaEurope & Central Asia (excluding high income)Europe & Central Asia (IDA & IBRD countries)European UnionFinlandFragile and conflict affected situationsFranceGabonGeorgiaGermanyGhanaGibraltarGreeceGuatemalaHaitiHeavily indebted poor countries (HIPC)High incomeHondurasHong Kong SAR, ChinaHungaryIBRD onlyIcelandIDA & IBRD totalIDA blendIDA onlyIDA totalIndiaIndonesiaIran, Islamic Rep.IraqIrelandIsraelItalyJamaicaJapanJordanKazakhstanKenyaKorea, Dem. People’s Rep.Korea, Rep.KosovoKuwaitKyrgyz RepublicLate-demographic dividendLatin America & Caribbean Latin America & Caribbean (excluding high income)Latin America & the Caribbean (IDA & IBRD countries)LatviaLeast developed countries: UN classificationLebanonLibyaLithuaniaLow & middle incomeLow incomeLower middle incomeLuxembourgMacedonia, FYRMalaysiaMaltaMauritiusMexicoMiddle East & North AfricaMiddle East & North Africa (excluding high income)Middle East & North Africa (IDA & IBRD countries)Middle incomeMoldovaMongoliaMontenegroMoroccoMozambiqueMyanmarNamibiaNepalNetherlandsNew ZealandNicaraguaNigerNigeriaNorth AmericaNorwayOECD membersOmanOther small statesPakistanPanamaParaguayPeruPhilippinesPolandPortugalPost-demographic dividendPre-demographic dividendQatarRomaniaRussian FederationSaudi ArabiaSenegalSerbiaSingaporeSlovak RepublicSloveniaSmall statesSouth AfricaSouth AsiaSouth Asia (IDA & IBRD)South SudanSpainSri LankaSub-Saharan Africa Sub-Saharan Africa (excluding high income)Sub-Saharan Africa (IDA & IBRD countries)SudanSwedenSwitzerlandSyrian Arab RepublicTajikistanTanzaniaThailandTogoTrinidad and TobagoTunisiaTurkeyTurkmenistanUkraineUnited Arab EmiratesUnited KingdomUnited StatesUpper middle incomeUruguayUzbekistanVenezuela, RBVietnamWorldYemen, Rep.ZambiaZimbabwe Timeline:
This timeline shows a graph from 1972 to 2014 of Ecuador. No data until 1971. Number of actual observations by date: 43.
Source name:
World Development Indicators
Source organization:
IEA Statistics © OECD/IEA 2014 (http://www.iea.org/stats/index.asp), subject to https://www.iea.org/t&c/termsandconditions/
Categories, topics:
Environment
Last updated:
apr 23, 2017
Indicators value changes by year
Minimum:
10.579
jan 1, 1974
Maximum:
18.691
jan 1, 1993
At the date of observation
Value
Absolute change
Change from previous value
jan 1, 1972
13.754
+13.754
0.0%
jan 1, 1973
11.364
-2.39
-17.38%
jan 1, 1974
10.579
-0.784
-6.9%
jan 1, 1975
13.576
+2.996
28.32%
jan 1, 1976
12.648
-0.928
-6.84%
jan 1, 1977
12.536
-0.111
-0.88%
jan 1, 1978
11.496
-1.041
-8.3%
jan 1, 1979
11.688
+0.193
1.68%
jan 1, 1980
13.608
+1.92
16.43%
jan 1, 1981
12.981
-0.627
-4.61%
jan 1, 1982
12.712
-0.269
-2.07%
jan 1, 1983
11.675
-1.037
-8.16%
jan 1, 1984
13.616
+1.941
16.62%
jan 1, 1985
12.701
-0.915
-6.72%
jan 1, 1986
15.609
+2.908
22.89%
jan 1, 1987
15.197
-0.412
-2.64%
jan 1, 1988
16.867
+1.67
10.99%
jan 1, 1989
12.856
-4.011
-23.78%
jan 1, 1990
13.478
+0.622
4.83%
jan 1, 1991
18.093
+4.616
34.25%
jan 1, 1992
18.188
+0.095
0.53%
jan 1, 1993
18.691
+0.503
2.76%
jan 1, 1994
17.735
-0.956
-5.11%
jan 1, 1995
18.658
+0.923
5.2%
jan 1, 1996
16.058
-2.6
-13.94%
jan 1, 1997
15.729
-0.328
-2.04%
jan 1, 1998
14.978
-0.751
-4.78%
jan 1, 1999
15.686
+0.708
4.73%
jan 1, 2000
17.07
+1.384
8.82%
jan 1, 2001
17.926
+0.856
5.01%
jan 1, 2002
16.079
-1.847
-10.3%
jan 1, 2003
16.717
+0.638
3.97%
jan 1, 2004
16.131
-0.586
-3.51%
jan 1, 2005
14.766
-1.365
-8.46%
jan 1, 2006
14.477
-0.289
-1.96%
jan 1, 2007
12.212
-2.265
-15.64%
jan 1, 2008
10.914
-1.298
-10.63%
jan 1, 2009
11.565
+0.652
5.97%
jan 1, 2010
12.284
+0.719
6.22%
jan 1, 2011
11.503
-0.782
-6.36%
jan 1, 2012
11.855
+0.352
3.06%
jan 1, 2013
12.077
+0.223
1.88%
jan 1, 2014
12.354
+0.277
2.29%
Ranking of countries by current statistics by years


Comments: