29
/
en
AIzaSyAYiBZKx7MnpbEhh9jyipgxe19OcubqV5w
April 1, 2024
31384
Europe & Central Asia (excluding high income)
ECA
false
2
1
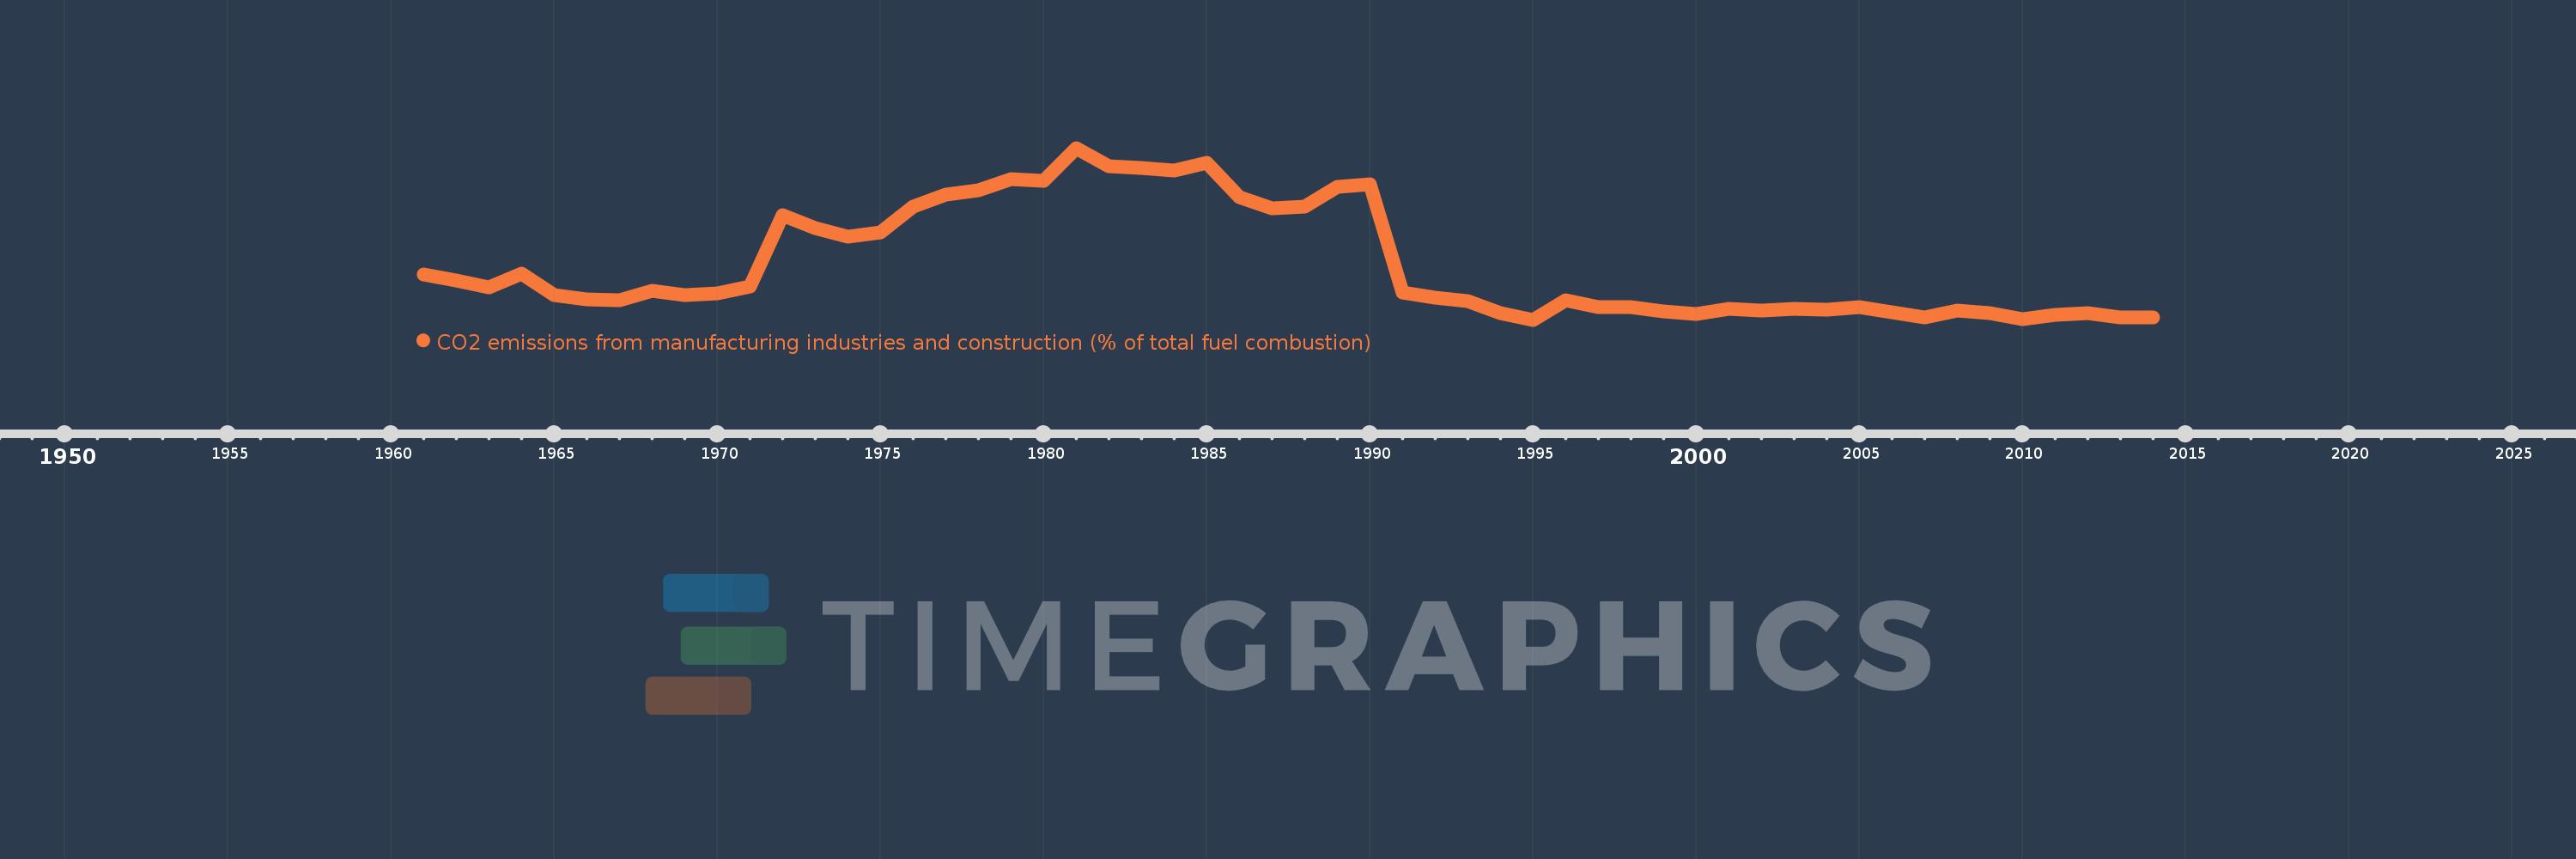
CO2 emissions from manufacturing industries and construction (% of total fuel combustion)
2014,2013,2012,2011,2010,2009,2008,2007,2006,2005,2004,2003,2002,2001,2000,1999,1998,1997,1996,1995,1994,1993,1992,1991,1990,1989,1988,1987,1986,1985,1984,1983,1982,1981,1980,1979,1978,1977,1976,1975,1974,1973,1972,1971,1970,1969,1968,1967,1966,1965,1964,1963,1962,1961
This statistics in other country:
AlbaniaAlgeriaAngolaArab WorldArgentinaArmeniaAustraliaAustriaAzerbaijanBahrainBangladeshBelarusBelgiumBeninBoliviaBosnia and HerzegovinaBotswanaBrazilBrunei DarussalamBulgariaCambodiaCameroonCanadaCaribbean small statesCentral Europe and the BalticsChileChinaColombiaCongo, Dem. Rep.Congo, Rep.Costa RicaCote d'IvoireCroatiaCubaCuracaoCyprusCzech RepublicDenmarkDominican RepublicEarly-demographic dividendEast Asia & PacificEast Asia & Pacific (excluding high income)East Asia & Pacific (IDA & IBRD countries)EcuadorEgypt, Arab Rep.El SalvadorEritreaEstoniaEthiopiaEuro areaEurope & Central AsiaEurope & Central Asia (excluding high income)Europe & Central Asia (IDA & IBRD countries)European UnionFinlandFragile and conflict affected situationsFranceGabonGeorgiaGermanyGhanaGibraltarGreeceGuatemalaHaitiHeavily indebted poor countries (HIPC)High incomeHondurasHong Kong SAR, ChinaHungaryIBRD onlyIcelandIDA & IBRD totalIDA blendIDA onlyIDA totalIndiaIndonesiaIran, Islamic Rep.IraqIrelandIsraelItalyJamaicaJapanJordanKazakhstanKenyaKorea, Dem. People’s Rep.Korea, Rep.KosovoKuwaitKyrgyz RepublicLate-demographic dividendLatin America & Caribbean Latin America & Caribbean (excluding high income)Latin America & the Caribbean (IDA & IBRD countries)LatviaLeast developed countries: UN classificationLebanonLibyaLithuaniaLow & middle incomeLow incomeLower middle incomeLuxembourgMacedonia, FYRMalaysiaMaltaMauritiusMexicoMiddle East & North AfricaMiddle East & North Africa (excluding high income)Middle East & North Africa (IDA & IBRD countries)Middle incomeMoldovaMongoliaMontenegroMoroccoMozambiqueMyanmarNamibiaNepalNetherlandsNew ZealandNicaraguaNigerNigeriaNorth AmericaNorwayOECD membersOmanOther small statesPakistanPanamaParaguayPeruPhilippinesPolandPortugalPost-demographic dividendPre-demographic dividendQatarRomaniaRussian FederationSaudi ArabiaSenegalSerbiaSingaporeSlovak RepublicSloveniaSmall statesSouth AfricaSouth AsiaSouth Asia (IDA & IBRD)South SudanSpainSri LankaSub-Saharan Africa Sub-Saharan Africa (excluding high income)Sub-Saharan Africa (IDA & IBRD countries)SudanSwedenSwitzerlandSyrian Arab RepublicTajikistanTanzaniaThailandTogoTrinidad and TobagoTunisiaTurkeyTurkmenistanUkraineUnited Arab EmiratesUnited KingdomUnited StatesUpper middle incomeUruguayUzbekistanVenezuela, RBVietnamWorldYemen, Rep.ZambiaZimbabwe Timeline:
This timeline shows a graph from 1961 to 2014 of Europe & Central Asia (excluding high income). No data until 1960. Number of actual observations by date: 54.
Source name:
World Development Indicators
Source organization:
IEA Statistics © OECD/IEA 2014 (http://www.iea.org/stats/index.asp), subject to https://www.iea.org/t&c/termsandconditions/
Categories, topics:
Environment
Last updated:
apr 23, 2017
Indicators value changes by year
Minimum:
13.787
jan 1, 1995
Maximum:
37.681
jan 1, 1981
At the date of observation
Value
Absolute change
Change from previous value
jan 1, 1961
20.095
+20.095
0.0%
jan 1, 1962
19.196
-0.9
-4.48%
jan 1, 1963
18.295
-0.901
-4.69%
jan 1, 1964
20.256
+1.962
10.72%
jan 1, 1965
17.266
-2.99
-14.76%
jan 1, 1966
16.596
-0.67
-3.88%
jan 1, 1967
16.44
-0.156
-0.94%
jan 1, 1968
17.85
+1.41
8.57%
jan 1, 1969
17.247
-0.603
-3.38%
jan 1, 1970
17.503
+0.256
1.48%
jan 1, 1971
18.361
+0.858
4.9%
jan 1, 1972
28.293
+9.933
54.1%
jan 1, 1973
26.483
-1.811
-6.4%
jan 1, 1974
25.373
-1.11
-4.19%
jan 1, 1975
25.984
+0.611
2.41%
jan 1, 1976
29.529
+3.546
13.65%
jan 1, 1977
31.202
+1.672
5.66%
jan 1, 1978
31.808
+0.607
1.94%
jan 1, 1979
33.347
+1.539
4.84%
jan 1, 1980
33.072
-0.276
-0.83%
jan 1, 1981
37.681
+4.609
13.94%
jan 1, 1982
35.176
-2.505
-6.65%
jan 1, 1983
34.938
-0.237
-0.67%
jan 1, 1984
34.536
-0.402
-1.15%
jan 1, 1985
35.607
+1.07
3.1%
jan 1, 1986
30.871
-4.736
-13.3%
jan 1, 1987
29.282
-1.589
-5.15%
jan 1, 1988
29.5
+0.218
0.74%
jan 1, 1989
32.247
+2.747
9.31%
jan 1, 1990
32.65
+0.403
1.25%
jan 1, 1991
17.56
-15.09
-46.22%
jan 1, 1992
16.876
-0.684
-3.9%
jan 1, 1993
16.381
-0.495
-2.93%
jan 1, 1994
14.75
-1.631
-9.96%
jan 1, 1995
13.787
-0.962
-6.53%
jan 1, 1996
16.44
+2.652
19.24%
jan 1, 1997
15.504
-0.936
-5.69%
jan 1, 1998
15.539
+0.035
0.23%
jan 1, 1999
14.989
-0.551
-3.54%
jan 1, 2000
14.599
-0.389
-2.6%
jan 1, 2001
15.285
+0.685
4.69%
jan 1, 2002
15.012
-0.273
-1.79%
jan 1, 2003
15.263
+0.252
1.68%
jan 1, 2004
15.17
-0.093
-0.61%
jan 1, 2005
15.531
+0.361
2.38%
jan 1, 2006
14.777
-0.755
-4.86%
jan 1, 2007
14.147
-0.629
-4.26%
jan 1, 2008
15.124
+0.977
6.9%
jan 1, 2009
14.705
-0.419
-2.77%
jan 1, 2010
13.923
-0.782
-5.32%
jan 1, 2011
14.42
+0.497
3.57%
jan 1, 2012
14.664
+0.245
1.7%
jan 1, 2013
14.134
-0.53
-3.61%
jan 1, 2014
14.139
+0.005
0.04%
Ranking of countries by current statistics by years


Comments: