29
/
en
AIzaSyAYiBZKx7MnpbEhh9jyipgxe19OcubqV5w
April 1, 2024
193981
Mauritius
MUS
true
2
1
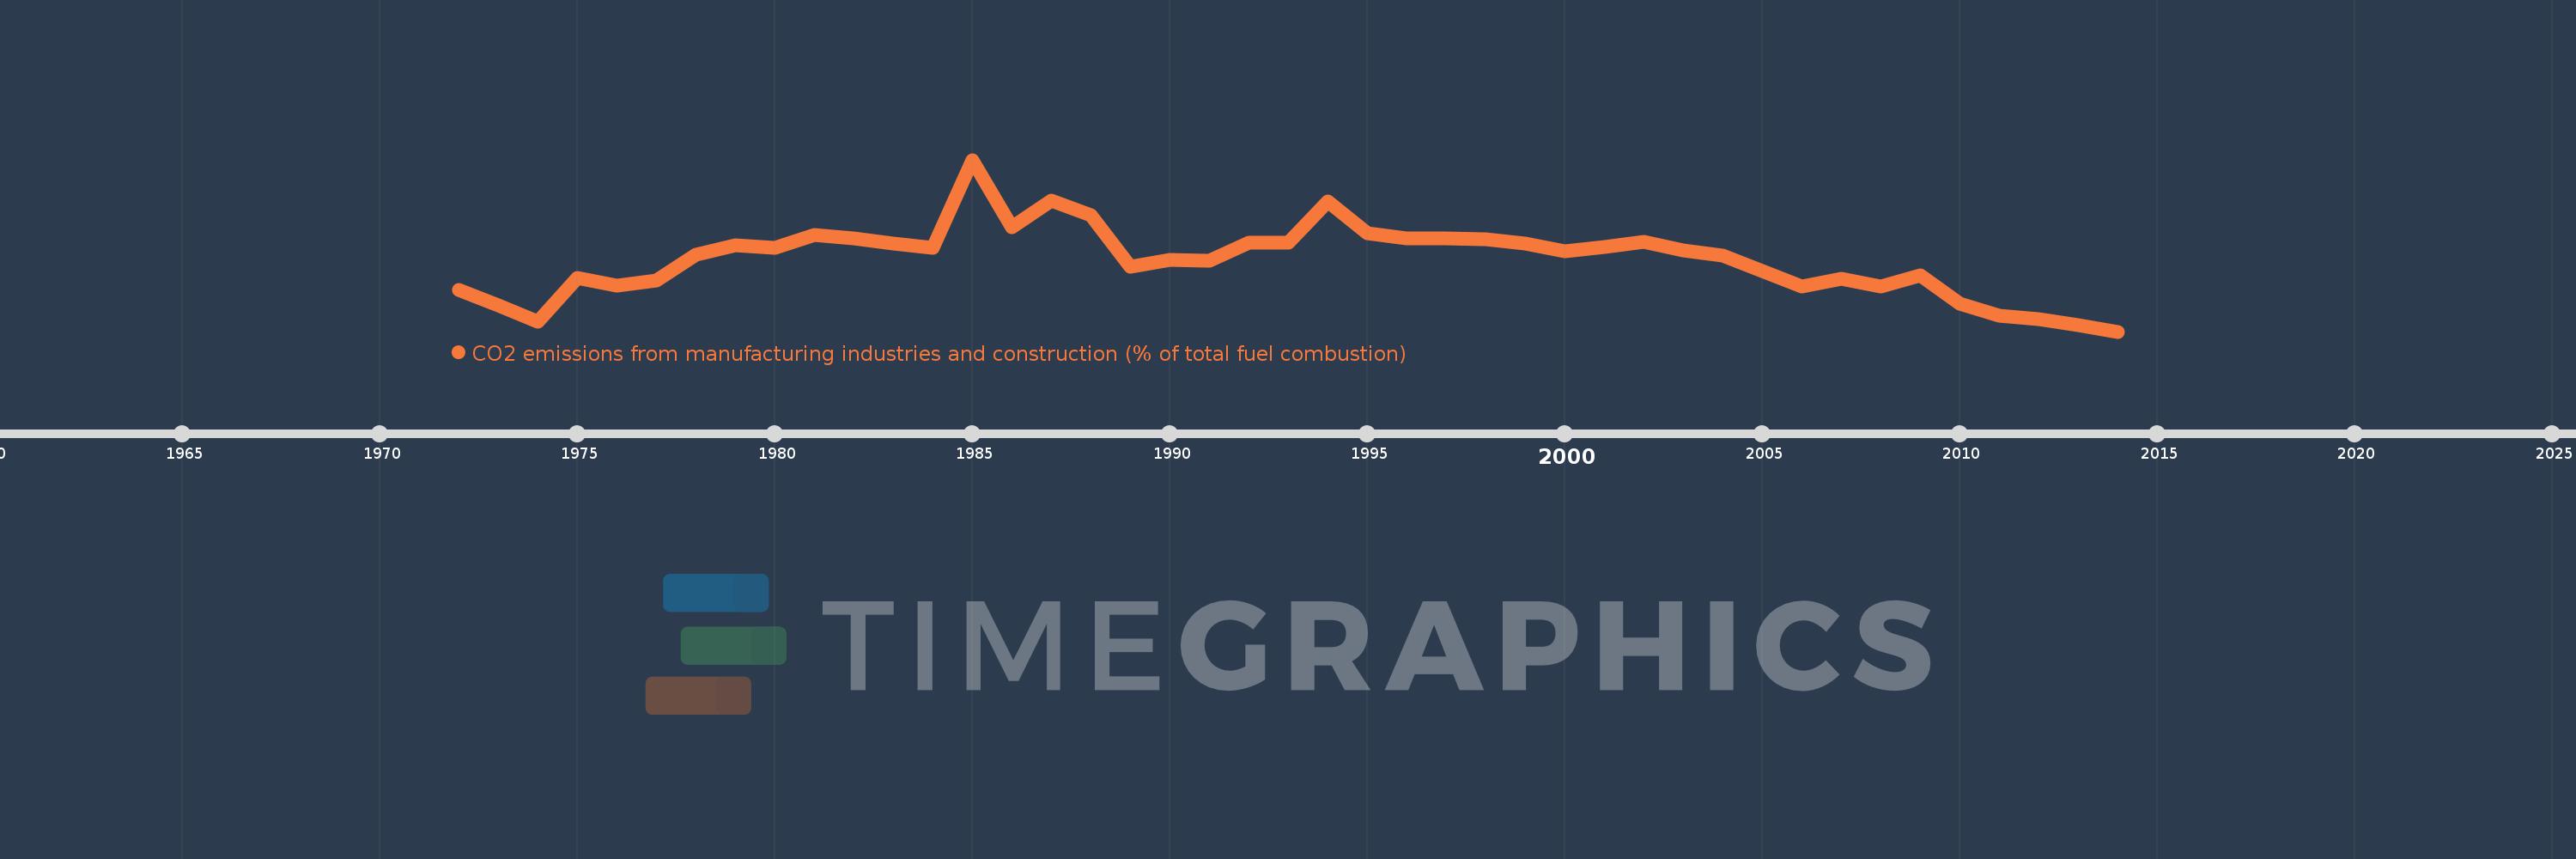
CO2 emissions from manufacturing industries and construction (% of total fuel combustion)
2014,2013,2012,2011,2010,2009,2008,2007,2006,2005,2004,2003,2002,2001,2000,1999,1998,1997,1996,1995,1994,1993,1992,1991,1990,1989,1988,1987,1986,1985,1984,1983,1982,1981,1980,1979,1978,1977,1976,1975,1974,1973,1972
This statistics in other country:
AlbaniaAlgeriaAngolaArab WorldArgentinaArmeniaAustraliaAustriaAzerbaijanBahrainBangladeshBelarusBelgiumBeninBoliviaBosnia and HerzegovinaBotswanaBrazilBrunei DarussalamBulgariaCambodiaCameroonCanadaCaribbean small statesCentral Europe and the BalticsChileChinaColombiaCongo, Dem. Rep.Congo, Rep.Costa RicaCote d'IvoireCroatiaCubaCuracaoCyprusCzech RepublicDenmarkDominican RepublicEarly-demographic dividendEast Asia & PacificEast Asia & Pacific (excluding high income)East Asia & Pacific (IDA & IBRD countries)EcuadorEgypt, Arab Rep.El SalvadorEritreaEstoniaEthiopiaEuro areaEurope & Central AsiaEurope & Central Asia (excluding high income)Europe & Central Asia (IDA & IBRD countries)European UnionFinlandFragile and conflict affected situationsFranceGabonGeorgiaGermanyGhanaGibraltarGreeceGuatemalaHaitiHeavily indebted poor countries (HIPC)High incomeHondurasHong Kong SAR, ChinaHungaryIBRD onlyIcelandIDA & IBRD totalIDA blendIDA onlyIDA totalIndiaIndonesiaIran, Islamic Rep.IraqIrelandIsraelItalyJamaicaJapanJordanKazakhstanKenyaKorea, Dem. People’s Rep.Korea, Rep.KosovoKuwaitKyrgyz RepublicLate-demographic dividendLatin America & Caribbean Latin America & Caribbean (excluding high income)Latin America & the Caribbean (IDA & IBRD countries)LatviaLeast developed countries: UN classificationLebanonLibyaLithuaniaLow & middle incomeLow incomeLower middle incomeLuxembourgMacedonia, FYRMalaysiaMaltaMauritiusMexicoMiddle East & North AfricaMiddle East & North Africa (excluding high income)Middle East & North Africa (IDA & IBRD countries)Middle incomeMoldovaMongoliaMontenegroMoroccoMozambiqueMyanmarNamibiaNepalNetherlandsNew ZealandNicaraguaNigerNigeriaNorth AmericaNorwayOECD membersOmanOther small statesPakistanPanamaParaguayPeruPhilippinesPolandPortugalPost-demographic dividendPre-demographic dividendQatarRomaniaRussian FederationSaudi ArabiaSenegalSerbiaSingaporeSlovak RepublicSloveniaSmall statesSouth AfricaSouth AsiaSouth Asia (IDA & IBRD)South SudanSpainSri LankaSub-Saharan Africa Sub-Saharan Africa (excluding high income)Sub-Saharan Africa (IDA & IBRD countries)SudanSwedenSwitzerlandSyrian Arab RepublicTajikistanTanzaniaThailandTogoTrinidad and TobagoTunisiaTurkeyTurkmenistanUkraineUnited Arab EmiratesUnited KingdomUnited StatesUpper middle incomeUruguayUzbekistanVenezuela, RBVietnamWorldYemen, Rep.ZambiaZimbabwe Timeline:
This timeline shows a graph from 1972 to 2014 of Mauritius. No data until 1971. Number of actual observations by date: 43.
Source name:
World Development Indicators
Source organization:
IEA Statistics © OECD/IEA 2014 (http://www.iea.org/stats/index.asp), subject to https://www.iea.org/t&c/termsandconditions/
Categories, topics:
Environment
Last updated:
apr 23, 2017
Indicators value changes by year
Maximum:
21.538
jan 1, 1985
At the date of observation
Value
Absolute change
Change from previous value
jan 1, 1972
11.538
+11.538
0.0%
jan 1, 1973
10.345
-1.194
-10.34%
jan 1, 1974
9.091
-1.254
-12.12%
jan 1, 1975
12.5
+3.409
37.5%
jan 1, 1976
11.905
-0.595
-4.76%
jan 1, 1977
12.245
+0.34
2.86%
jan 1, 1978
14.286
+2.041
16.67%
jan 1, 1979
15.0
+0.714
5.0%
jan 1, 1980
14.754
-0.246
-1.64%
jan 1, 1981
15.789
+1.035
7.02%
jan 1, 1982
15.517
-0.272
-1.72%
jan 1, 1983
15.094
-0.423
-2.73%
jan 1, 1984
14.754
-0.34
-2.25%
jan 1, 1985
21.538
+6.784
45.98%
jan 1, 1986
16.393
-5.145
-23.89%
jan 1, 1987
18.421
+2.028
12.37%
jan 1, 1988
17.284
-1.137
-6.17%
jan 1, 1989
13.333
-3.951
-22.86%
jan 1, 1990
13.861
+0.528
3.96%
jan 1, 1991
13.793
-0.068
-0.49%
jan 1, 1992
15.2
+1.407
10.2%
jan 1, 1993
15.152
-0.048
-0.32%
jan 1, 1994
18.367
+3.216
21.22%
jan 1, 1995
15.894
-2.473
-13.47%
jan 1, 1996
15.484
-0.41
-2.58%
jan 1, 1997
15.528
+0.044
0.28%
jan 1, 1998
15.432
-0.096
-0.62%
jan 1, 1999
15.084
-0.348
-2.26%
jan 1, 2000
14.545
-0.538
-3.57%
jan 1, 2001
14.815
+0.269
1.85%
jan 1, 2002
15.234
+0.42
2.83%
jan 1, 2003
14.559
-0.675
-4.43%
jan 1, 2004
14.182
-0.378
-2.59%
jan 1, 2005
12.996
-1.185
-8.36%
jan 1, 2006
11.824
-1.172
-9.02%
jan 1, 2007
12.424
+0.6
5.07%
jan 1, 2008
11.799
-0.625
-5.03%
jan 1, 2009
12.68
+0.881
7.46%
jan 1, 2010
10.526
-2.154
-16.99%
jan 1, 2011
9.563
-0.963
-9.15%
jan 1, 2012
9.341
-0.222
-2.32%
jan 1, 2013
8.847
-0.493
-5.28%
jan 1, 2014
8.355
-0.492
-5.56%
Ranking of countries by current statistics by years


Comments: