29
/
en
AIzaSyAYiBZKx7MnpbEhh9jyipgxe19OcubqV5w
April 1, 2024
113347
Cote d'Ivoire
CIV
true
2
1
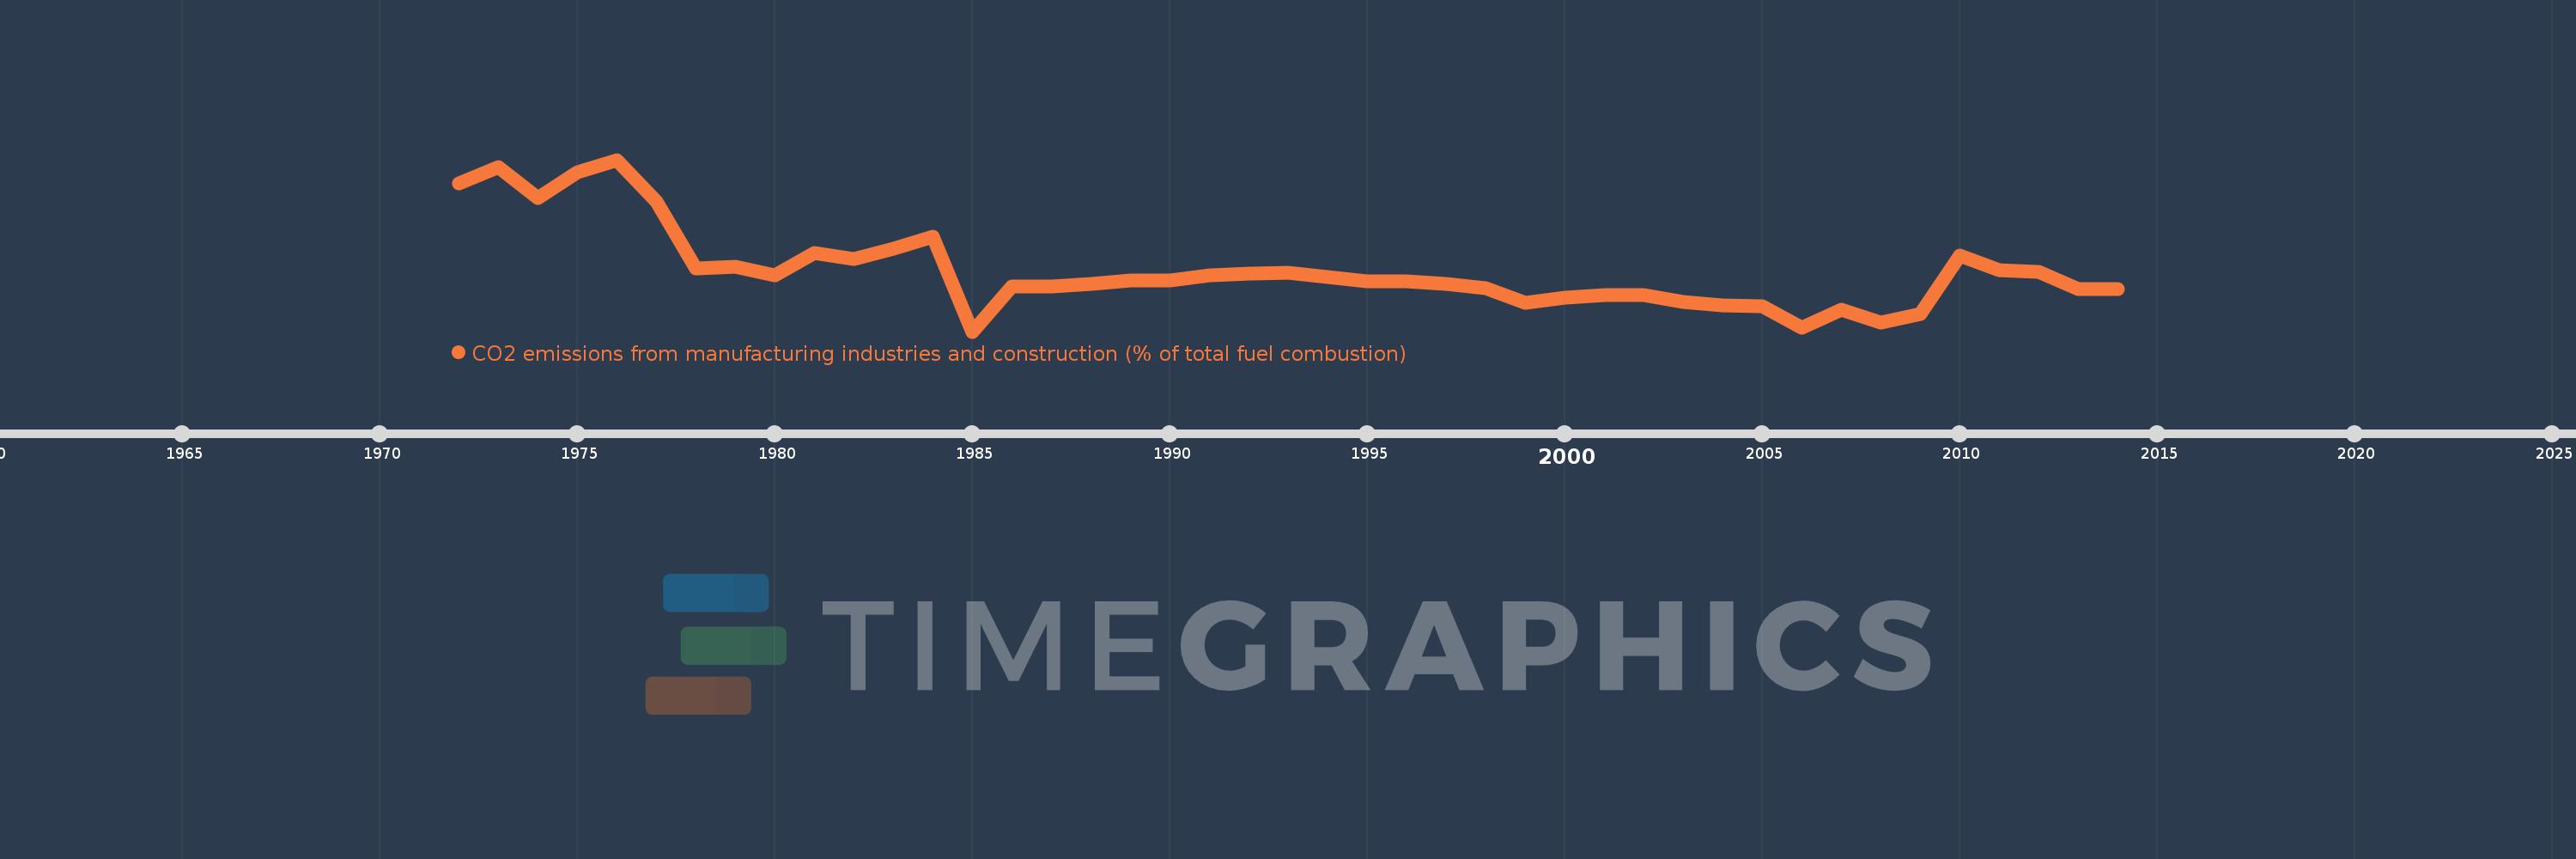
CO2 emissions from manufacturing industries and construction (% of total fuel combustion)
2014,2013,2012,2011,2010,2009,2008,2007,2006,2005,2004,2003,2002,2001,2000,1999,1998,1997,1996,1995,1994,1993,1992,1991,1990,1989,1988,1987,1986,1985,1984,1983,1982,1981,1980,1979,1978,1977,1976,1975,1974,1973,1972
This statistics in other country:
AlbaniaAlgeriaAngolaArab WorldArgentinaArmeniaAustraliaAustriaAzerbaijanBahrainBangladeshBelarusBelgiumBeninBoliviaBosnia and HerzegovinaBotswanaBrazilBrunei DarussalamBulgariaCambodiaCameroonCanadaCaribbean small statesCentral Europe and the BalticsChileChinaColombiaCongo, Dem. Rep.Congo, Rep.Costa RicaCote d'IvoireCroatiaCubaCuracaoCyprusCzech RepublicDenmarkDominican RepublicEarly-demographic dividendEast Asia & PacificEast Asia & Pacific (excluding high income)East Asia & Pacific (IDA & IBRD countries)EcuadorEgypt, Arab Rep.El SalvadorEritreaEstoniaEthiopiaEuro areaEurope & Central AsiaEurope & Central Asia (excluding high income)Europe & Central Asia (IDA & IBRD countries)European UnionFinlandFragile and conflict affected situationsFranceGabonGeorgiaGermanyGhanaGibraltarGreeceGuatemalaHaitiHeavily indebted poor countries (HIPC)High incomeHondurasHong Kong SAR, ChinaHungaryIBRD onlyIcelandIDA & IBRD totalIDA blendIDA onlyIDA totalIndiaIndonesiaIran, Islamic Rep.IraqIrelandIsraelItalyJamaicaJapanJordanKazakhstanKenyaKorea, Dem. People’s Rep.Korea, Rep.KosovoKuwaitKyrgyz RepublicLate-demographic dividendLatin America & Caribbean Latin America & Caribbean (excluding high income)Latin America & the Caribbean (IDA & IBRD countries)LatviaLeast developed countries: UN classificationLebanonLibyaLithuaniaLow & middle incomeLow incomeLower middle incomeLuxembourgMacedonia, FYRMalaysiaMaltaMauritiusMexicoMiddle East & North AfricaMiddle East & North Africa (excluding high income)Middle East & North Africa (IDA & IBRD countries)Middle incomeMoldovaMongoliaMontenegroMoroccoMozambiqueMyanmarNamibiaNepalNetherlandsNew ZealandNicaraguaNigerNigeriaNorth AmericaNorwayOECD membersOmanOther small statesPakistanPanamaParaguayPeruPhilippinesPolandPortugalPost-demographic dividendPre-demographic dividendQatarRomaniaRussian FederationSaudi ArabiaSenegalSerbiaSingaporeSlovak RepublicSloveniaSmall statesSouth AfricaSouth AsiaSouth Asia (IDA & IBRD)South SudanSpainSri LankaSub-Saharan Africa Sub-Saharan Africa (excluding high income)Sub-Saharan Africa (IDA & IBRD countries)SudanSwedenSwitzerlandSyrian Arab RepublicTajikistanTanzaniaThailandTogoTrinidad and TobagoTunisiaTurkeyTurkmenistanUkraineUnited Arab EmiratesUnited KingdomUnited StatesUpper middle incomeUruguayUzbekistanVenezuela, RBVietnamWorldYemen, Rep.ZambiaZimbabwe Timeline:
This timeline shows a graph from 1972 to 2014 of Cote d'Ivoire. No data until 1971. Number of actual observations by date: 43.
Source name:
World Development Indicators
Source organization:
IEA Statistics © OECD/IEA 2014 (http://www.iea.org/stats/index.asp), subject to https://www.iea.org/t&c/termsandconditions/
Categories, topics:
Environment
Last updated:
apr 23, 2017
Indicators value changes by year
Maximum:
32.895
jan 1, 1976
At the date of observation
Value
Absolute change
Change from previous value
jan 1, 1972
29.167
+29.167
0.0%
jan 1, 1973
31.698
+2.531
8.68%
jan 1, 1974
26.937
-4.761
-15.02%
jan 1, 1975
30.961
+4.024
14.94%
jan 1, 1976
32.895
+1.934
6.25%
jan 1, 1977
26.437
-6.458
-19.63%
jan 1, 1978
15.836
-10.601
-40.1%
jan 1, 1979
16.08
+0.245
1.54%
jan 1, 1980
14.795
-1.286
-8.0%
jan 1, 1981
18.289
+3.495
23.62%
jan 1, 1982
17.391
-0.898
-4.91%
jan 1, 1983
18.919
+1.528
8.78%
jan 1, 1984
20.856
+1.937
10.24%
jan 1, 1985
5.988
-14.868
-71.29%
jan 1, 1986
13.115
+7.127
119.02%
jan 1, 1987
12.987
-0.128
-0.97%
jan 1, 1988
13.443
+0.456
3.51%
jan 1, 1989
14.052
+0.61
4.54%
jan 1, 1990
13.993
-0.059
-0.42%
jan 1, 1991
14.815
+0.822
5.87%
jan 1, 1992
15.054
+0.239
1.61%
jan 1, 1993
15.162
+0.109
0.72%
jan 1, 1994
14.527
-0.635
-4.19%
jan 1, 1995
13.916
-0.611
-4.21%
jan 1, 1996
13.804
-0.112
-0.81%
jan 1, 1997
13.437
-0.367
-2.66%
jan 1, 1998
12.762
-0.675
-5.02%
jan 1, 1999
10.559
-2.203
-17.26%
jan 1, 2000
11.36
+0.801
7.59%
jan 1, 2001
11.69
+0.33
2.91%
jan 1, 2002
11.661
-0.029
-0.25%
jan 1, 2003
10.658
-1.003
-8.6%
jan 1, 2004
10.097
-0.561
-5.27%
jan 1, 2005
9.963
-0.134
-1.33%
jan 1, 2006
6.54
-3.423
-34.35%
jan 1, 2007
9.414
+2.873
43.93%
jan 1, 2008
7.387
-2.026
-21.53%
jan 1, 2009
8.805
+1.418
19.19%
jan 1, 2010
17.905
+9.1
103.35%
jan 1, 2011
15.62
-2.285
-12.76%
jan 1, 2012
15.358
-0.262
-1.67%
jan 1, 2013
12.69
-2.668
-17.37%
jan 1, 2014
12.673
-0.018
-0.14%
Ranking of countries by current statistics by years


Comments: