29
/
en
AIzaSyAYiBZKx7MnpbEhh9jyipgxe19OcubqV5w
April 1, 2024
282032
Vietnam
VNM
true
2
1
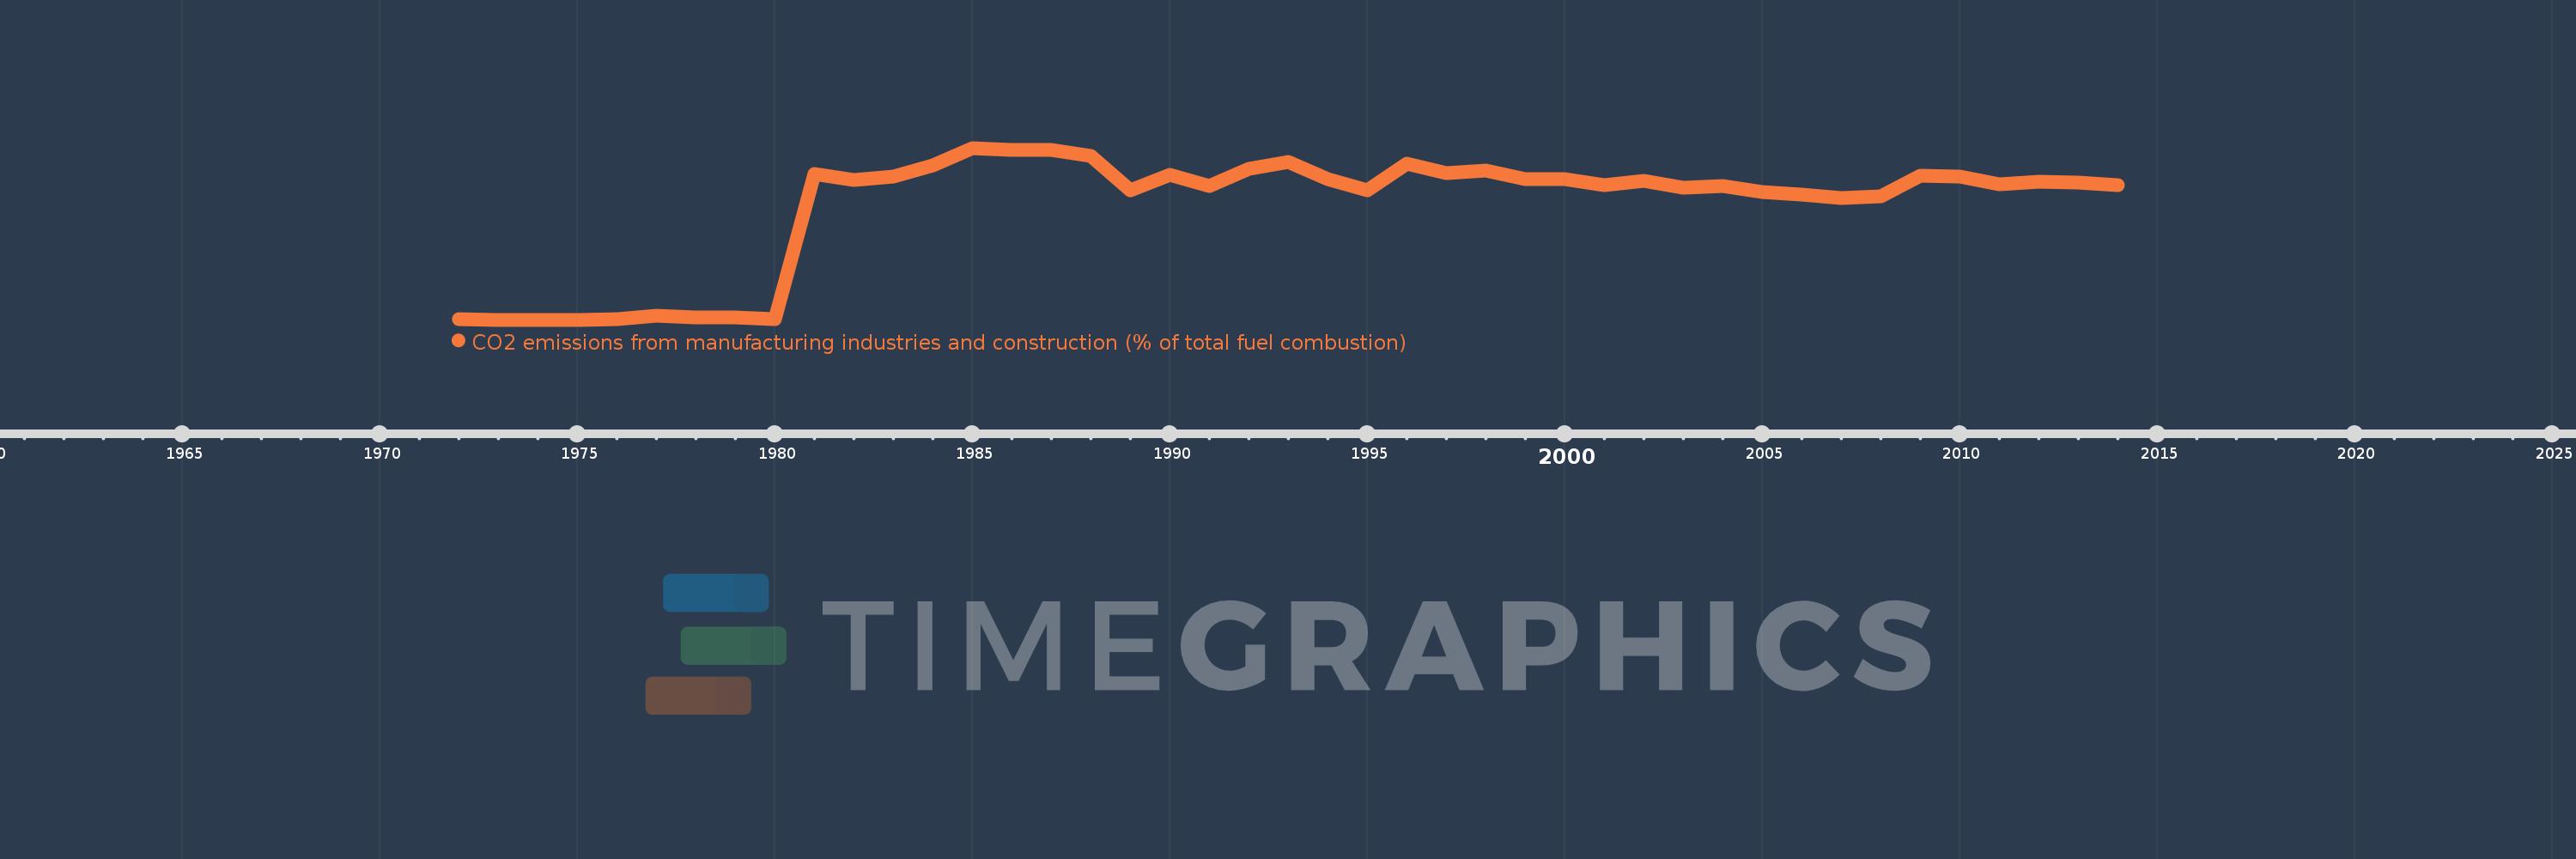
CO2 emissions from manufacturing industries and construction (% of total fuel combustion)
2014,2013,2012,2011,2010,2009,2008,2007,2006,2005,2004,2003,2002,2001,2000,1999,1998,1997,1996,1995,1994,1993,1992,1991,1990,1989,1988,1987,1986,1985,1984,1983,1982,1981,1980,1979,1978,1977,1976,1975,1974,1973,1972
This statistics in other country:
AlbaniaAlgeriaAngolaArab WorldArgentinaArmeniaAustraliaAustriaAzerbaijanBahrainBangladeshBelarusBelgiumBeninBoliviaBosnia and HerzegovinaBotswanaBrazilBrunei DarussalamBulgariaCambodiaCameroonCanadaCaribbean small statesCentral Europe and the BalticsChileChinaColombiaCongo, Dem. Rep.Congo, Rep.Costa RicaCote d'IvoireCroatiaCubaCuracaoCyprusCzech RepublicDenmarkDominican RepublicEarly-demographic dividendEast Asia & PacificEast Asia & Pacific (excluding high income)East Asia & Pacific (IDA & IBRD countries)EcuadorEgypt, Arab Rep.El SalvadorEritreaEstoniaEthiopiaEuro areaEurope & Central AsiaEurope & Central Asia (excluding high income)Europe & Central Asia (IDA & IBRD countries)European UnionFinlandFragile and conflict affected situationsFranceGabonGeorgiaGermanyGhanaGibraltarGreeceGuatemalaHaitiHeavily indebted poor countries (HIPC)High incomeHondurasHong Kong SAR, ChinaHungaryIBRD onlyIcelandIDA & IBRD totalIDA blendIDA onlyIDA totalIndiaIndonesiaIran, Islamic Rep.IraqIrelandIsraelItalyJamaicaJapanJordanKazakhstanKenyaKorea, Dem. People’s Rep.Korea, Rep.KosovoKuwaitKyrgyz RepublicLate-demographic dividendLatin America & Caribbean Latin America & Caribbean (excluding high income)Latin America & the Caribbean (IDA & IBRD countries)LatviaLeast developed countries: UN classificationLebanonLibyaLithuaniaLow & middle incomeLow incomeLower middle incomeLuxembourgMacedonia, FYRMalaysiaMaltaMauritiusMexicoMiddle East & North AfricaMiddle East & North Africa (excluding high income)Middle East & North Africa (IDA & IBRD countries)Middle incomeMoldovaMongoliaMontenegroMoroccoMozambiqueMyanmarNamibiaNepalNetherlandsNew ZealandNicaraguaNigerNigeriaNorth AmericaNorwayOECD membersOmanOther small statesPakistanPanamaParaguayPeruPhilippinesPolandPortugalPost-demographic dividendPre-demographic dividendQatarRomaniaRussian FederationSaudi ArabiaSenegalSerbiaSingaporeSlovak RepublicSloveniaSmall statesSouth AfricaSouth AsiaSouth Asia (IDA & IBRD)South SudanSpainSri LankaSub-Saharan Africa Sub-Saharan Africa (excluding high income)Sub-Saharan Africa (IDA & IBRD countries)SudanSwedenSwitzerlandSyrian Arab RepublicTajikistanTanzaniaThailandTogoTrinidad and TobagoTunisiaTurkeyTurkmenistanUkraineUnited Arab EmiratesUnited KingdomUnited StatesUpper middle incomeUruguayUzbekistanVenezuela, RBVietnamWorldYemen, Rep.ZambiaZimbabwe Timeline:
This timeline shows a graph from 1972 to 2014 of Vietnam. No data until 1971. Number of actual observations by date: 43.
Source name:
World Development Indicators
Source organization:
IEA Statistics © OECD/IEA 2014 (http://www.iea.org/stats/index.asp), subject to https://www.iea.org/t&c/termsandconditions/
Categories, topics:
Environment
Last updated:
apr 23, 2017
Indicators value changes by year
Maximum:
41.739
jan 1, 1985
At the date of observation
Value
Absolute change
Change from previous value
jan 1, 1972
0.123
+0.123
0.0%
jan 1, 1973
0.0
-0.123
-100.0%
jan 1, 1976
0.177
+0.177
%
jan 1, 1977
1.02
+0.843
476.04%
jan 1, 1978
0.471
-0.549
-53.81%
jan 1, 1979
0.597
+0.126
26.77%
jan 1, 1980
0.071
-0.526
-88.19%
jan 1, 1981
35.503
+35.433
50.24K%
jan 1, 1982
33.966
-1.537
-4.33%
jan 1, 1983
34.854
+0.888
2.61%
jan 1, 1984
37.564
+2.71
7.78%
jan 1, 1985
41.739
+4.174
11.11%
jan 1, 1986
41.308
-0.431
-1.03%
jan 1, 1987
41.287
-0.021
-0.05%
jan 1, 1988
39.898
-1.389
-3.36%
jan 1, 1989
31.435
-8.463
-21.21%
jan 1, 1990
35.301
+3.865
12.3%
jan 1, 1991
32.566
-2.735
-7.75%
jan 1, 1992
36.593
+4.026
12.36%
jan 1, 1993
38.292
+1.699
4.64%
jan 1, 1994
34.154
-4.137
-10.8%
jan 1, 1995
31.525
-2.629
-7.7%
jan 1, 1996
37.996
+6.471
20.53%
jan 1, 1997
35.61
-2.386
-6.28%
jan 1, 1998
36.219
+0.609
1.71%
jan 1, 1999
34.071
-2.148
-5.93%
jan 1, 2000
34.145
+0.073
0.22%
jan 1, 2001
32.632
-1.512
-4.43%
jan 1, 2002
33.675
+1.043
3.2%
jan 1, 2003
32.045
-1.63
-4.84%
jan 1, 2004
32.554
+0.509
1.59%
jan 1, 2005
31.019
-1.535
-4.72%
jan 1, 2006
30.408
-0.61
-1.97%
jan 1, 2007
29.652
-0.756
-2.49%
jan 1, 2008
29.903
+0.251
0.85%
jan 1, 2009
35.007
+5.104
17.07%
jan 1, 2010
34.892
-0.115
-0.33%
jan 1, 2011
32.961
-1.932
-5.54%
jan 1, 2012
33.541
+0.581
1.76%
jan 1, 2013
33.323
-0.219
-0.65%
jan 1, 2014
32.687
-0.635
-1.91%
Ranking of countries by current statistics by years


Comments: