29
/
en
AIzaSyAYiBZKx7MnpbEhh9jyipgxe19OcubqV5w
April 1, 2024
228232
Romania
ROU
true
2
1
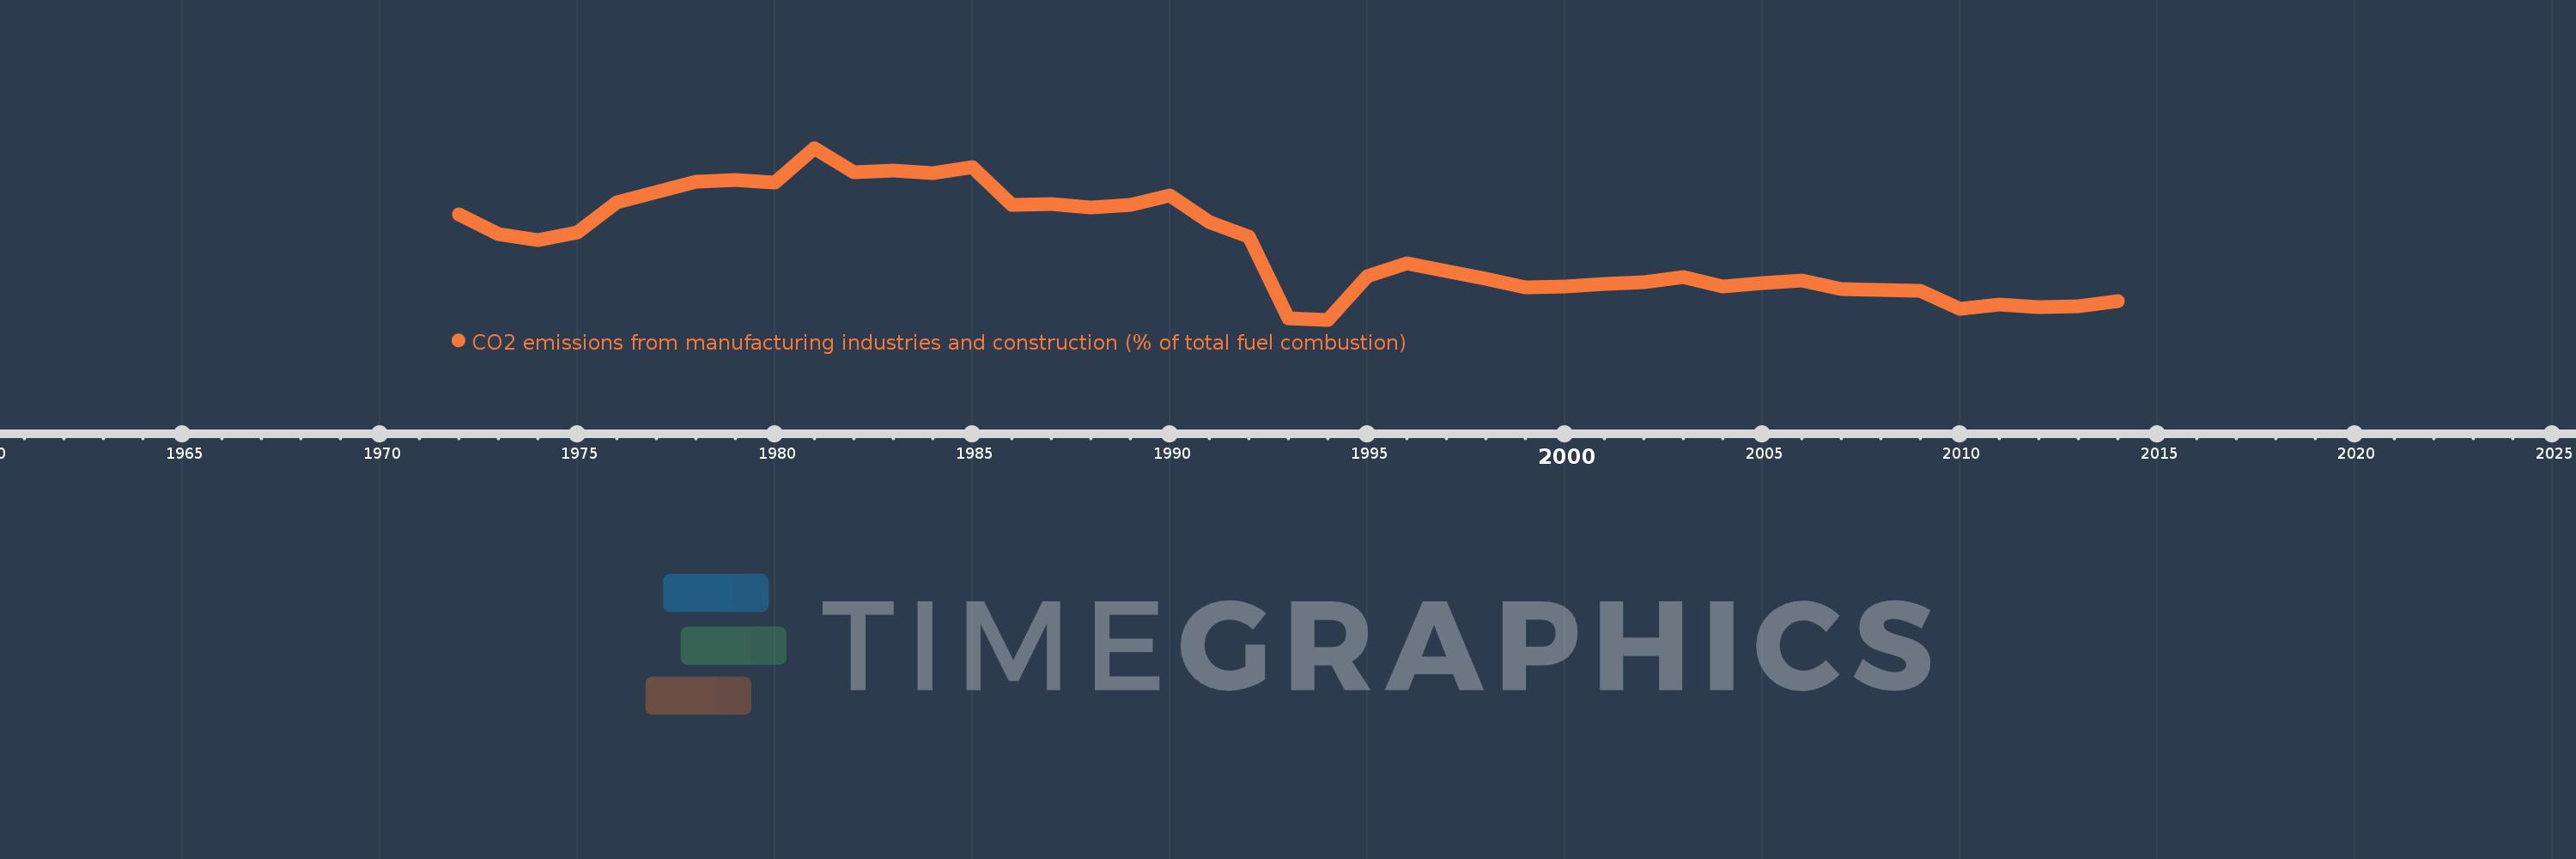
CO2 emissions from manufacturing industries and construction (% of total fuel combustion)
2014,2013,2012,2011,2010,2009,2008,2007,2006,2005,2004,2003,2002,2001,2000,1999,1998,1997,1996,1995,1994,1993,1992,1991,1990,1989,1988,1987,1986,1985,1984,1983,1982,1981,1980,1979,1978,1977,1976,1975,1974,1973,1972
This statistics in other country:
AlbaniaAlgeriaAngolaArab WorldArgentinaArmeniaAustraliaAustriaAzerbaijanBahrainBangladeshBelarusBelgiumBeninBoliviaBosnia and HerzegovinaBotswanaBrazilBrunei DarussalamBulgariaCambodiaCameroonCanadaCaribbean small statesCentral Europe and the BalticsChileChinaColombiaCongo, Dem. Rep.Congo, Rep.Costa RicaCote d'IvoireCroatiaCubaCuracaoCyprusCzech RepublicDenmarkDominican RepublicEarly-demographic dividendEast Asia & PacificEast Asia & Pacific (excluding high income)East Asia & Pacific (IDA & IBRD countries)EcuadorEgypt, Arab Rep.El SalvadorEritreaEstoniaEthiopiaEuro areaEurope & Central AsiaEurope & Central Asia (excluding high income)Europe & Central Asia (IDA & IBRD countries)European UnionFinlandFragile and conflict affected situationsFranceGabonGeorgiaGermanyGhanaGibraltarGreeceGuatemalaHaitiHeavily indebted poor countries (HIPC)High incomeHondurasHong Kong SAR, ChinaHungaryIBRD onlyIcelandIDA & IBRD totalIDA blendIDA onlyIDA totalIndiaIndonesiaIran, Islamic Rep.IraqIrelandIsraelItalyJamaicaJapanJordanKazakhstanKenyaKorea, Dem. People’s Rep.Korea, Rep.KosovoKuwaitKyrgyz RepublicLate-demographic dividendLatin America & Caribbean Latin America & Caribbean (excluding high income)Latin America & the Caribbean (IDA & IBRD countries)LatviaLeast developed countries: UN classificationLebanonLibyaLithuaniaLow & middle incomeLow incomeLower middle incomeLuxembourgMacedonia, FYRMalaysiaMaltaMauritiusMexicoMiddle East & North AfricaMiddle East & North Africa (excluding high income)Middle East & North Africa (IDA & IBRD countries)Middle incomeMoldovaMongoliaMontenegroMoroccoMozambiqueMyanmarNamibiaNepalNetherlandsNew ZealandNicaraguaNigerNigeriaNorth AmericaNorwayOECD membersOmanOther small statesPakistanPanamaParaguayPeruPhilippinesPolandPortugalPost-demographic dividendPre-demographic dividendQatarRomaniaRussian FederationSaudi ArabiaSenegalSerbiaSingaporeSlovak RepublicSloveniaSmall statesSouth AfricaSouth AsiaSouth Asia (IDA & IBRD)South SudanSpainSri LankaSub-Saharan Africa Sub-Saharan Africa (excluding high income)Sub-Saharan Africa (IDA & IBRD countries)SudanSwedenSwitzerlandSyrian Arab RepublicTajikistanTanzaniaThailandTogoTrinidad and TobagoTunisiaTurkeyTurkmenistanUkraineUnited Arab EmiratesUnited KingdomUnited StatesUpper middle incomeUruguayUzbekistanVenezuela, RBVietnamWorldYemen, Rep.ZambiaZimbabwe Timeline:
This timeline shows a graph from 1972 to 2014 of Romania. No data until 1971. Number of actual observations by date: 43.
Source name:
World Development Indicators
Source organization:
IEA Statistics © OECD/IEA 2014 (http://www.iea.org/stats/index.asp), subject to https://www.iea.org/t&c/termsandconditions/
Categories, topics:
Environment
Last updated:
apr 23, 2017
Indicators value changes by year
Minimum:
13.626
jan 1, 1994
Maximum:
52.825
jan 1, 1981
At the date of observation
Value
Absolute change
Change from previous value
jan 1, 1972
37.584
+37.584
0.0%
jan 1, 1973
33.08
-4.504
-11.98%
jan 1, 1974
31.8
-1.28
-3.87%
jan 1, 1975
33.475
+1.675
5.27%
jan 1, 1976
40.485
+7.011
20.94%
jan 1, 1977
42.8
+2.315
5.72%
jan 1, 1978
45.125
+2.324
5.43%
jan 1, 1979
45.451
+0.327
0.72%
jan 1, 1980
44.869
-0.582
-1.28%
jan 1, 1981
52.825
+7.956
17.73%
jan 1, 1982
47.196
-5.629
-10.66%
jan 1, 1983
47.696
+0.5
1.06%
jan 1, 1984
47.029
-0.668
-1.4%
jan 1, 1985
48.485
+1.456
3.1%
jan 1, 1986
39.841
-8.644
-17.83%
jan 1, 1987
39.983
+0.142
0.36%
jan 1, 1988
39.334
-0.649
-1.62%
jan 1, 1989
39.909
+0.575
1.46%
jan 1, 1990
41.894
+1.985
4.97%
jan 1, 1991
35.886
-6.008
-14.34%
jan 1, 1992
32.596
-3.29
-9.17%
jan 1, 1993
13.914
-18.681
-57.31%
jan 1, 1994
13.626
-0.288
-2.07%
jan 1, 1995
23.558
+9.932
72.89%
jan 1, 1996
26.484
+2.925
12.42%
jan 1, 1997
24.733
-1.75
-6.61%
jan 1, 1998
22.947
-1.787
-7.22%
jan 1, 1999
20.958
-1.989
-8.67%
jan 1, 2000
21.262
+0.305
1.45%
jan 1, 2001
21.73
+0.468
2.2%
jan 1, 2002
22.143
+0.413
1.9%
jan 1, 2003
23.284
+1.141
5.15%
jan 1, 2004
21.258
-2.026
-8.7%
jan 1, 2005
22.035
+0.777
3.66%
jan 1, 2006
22.556
+0.521
2.36%
jan 1, 2007
20.636
-1.92
-8.51%
jan 1, 2008
20.458
-0.177
-0.86%
jan 1, 2009
20.208
-0.25
-1.22%
jan 1, 2010
16.187
-4.021
-19.9%
jan 1, 2011
17.081
+0.894
5.53%
jan 1, 2012
16.452
-0.629
-3.68%
jan 1, 2013
16.703
+0.25
1.52%
jan 1, 2014
17.882
+1.179
7.06%
Ranking of countries by current statistics by years


Comments: