29
/
en
AIzaSyAYiBZKx7MnpbEhh9jyipgxe19OcubqV5w
April 1, 2024
234461
Saudi Arabia
SAU
true
2
1
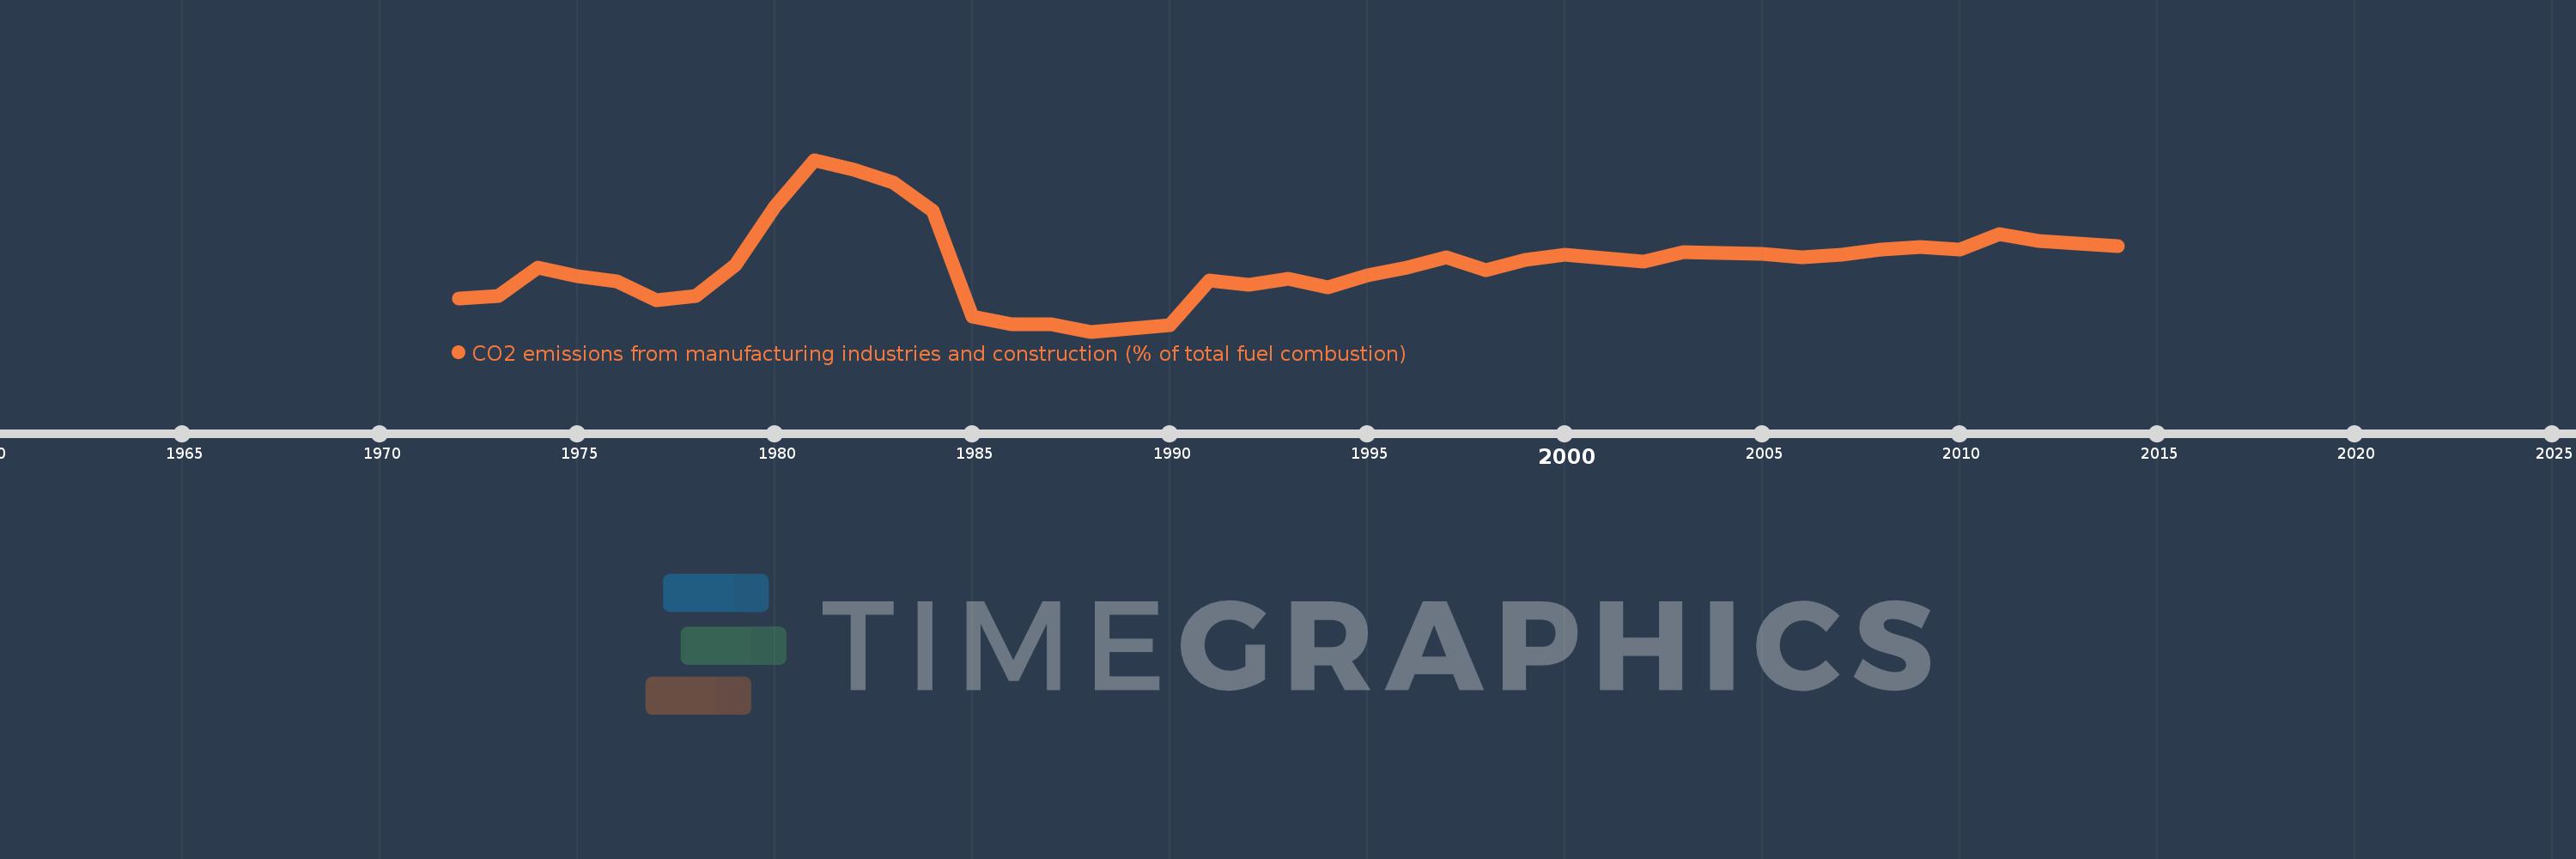
CO2 emissions from manufacturing industries and construction (% of total fuel combustion)
2014,2013,2012,2011,2010,2009,2008,2007,2006,2005,2004,2003,2002,2001,2000,1999,1998,1997,1996,1995,1994,1993,1992,1991,1990,1989,1988,1987,1986,1985,1984,1983,1982,1981,1980,1979,1978,1977,1976,1975,1974,1973,1972
This statistics in other country:
AlbaniaAlgeriaAngolaArab WorldArgentinaArmeniaAustraliaAustriaAzerbaijanBahrainBangladeshBelarusBelgiumBeninBoliviaBosnia and HerzegovinaBotswanaBrazilBrunei DarussalamBulgariaCambodiaCameroonCanadaCaribbean small statesCentral Europe and the BalticsChileChinaColombiaCongo, Dem. Rep.Congo, Rep.Costa RicaCote d'IvoireCroatiaCubaCuracaoCyprusCzech RepublicDenmarkDominican RepublicEarly-demographic dividendEast Asia & PacificEast Asia & Pacific (excluding high income)East Asia & Pacific (IDA & IBRD countries)EcuadorEgypt, Arab Rep.El SalvadorEritreaEstoniaEthiopiaEuro areaEurope & Central AsiaEurope & Central Asia (excluding high income)Europe & Central Asia (IDA & IBRD countries)European UnionFinlandFragile and conflict affected situationsFranceGabonGeorgiaGermanyGhanaGibraltarGreeceGuatemalaHaitiHeavily indebted poor countries (HIPC)High incomeHondurasHong Kong SAR, ChinaHungaryIBRD onlyIcelandIDA & IBRD totalIDA blendIDA onlyIDA totalIndiaIndonesiaIran, Islamic Rep.IraqIrelandIsraelItalyJamaicaJapanJordanKazakhstanKenyaKorea, Dem. People’s Rep.Korea, Rep.KosovoKuwaitKyrgyz RepublicLate-demographic dividendLatin America & Caribbean Latin America & Caribbean (excluding high income)Latin America & the Caribbean (IDA & IBRD countries)LatviaLeast developed countries: UN classificationLebanonLibyaLithuaniaLow & middle incomeLow incomeLower middle incomeLuxembourgMacedonia, FYRMalaysiaMaltaMauritiusMexicoMiddle East & North AfricaMiddle East & North Africa (excluding high income)Middle East & North Africa (IDA & IBRD countries)Middle incomeMoldovaMongoliaMontenegroMoroccoMozambiqueMyanmarNamibiaNepalNetherlandsNew ZealandNicaraguaNigerNigeriaNorth AmericaNorwayOECD membersOmanOther small statesPakistanPanamaParaguayPeruPhilippinesPolandPortugalPost-demographic dividendPre-demographic dividendQatarRomaniaRussian FederationSaudi ArabiaSenegalSerbiaSingaporeSlovak RepublicSloveniaSmall statesSouth AfricaSouth AsiaSouth Asia (IDA & IBRD)South SudanSpainSri LankaSub-Saharan Africa Sub-Saharan Africa (excluding high income)Sub-Saharan Africa (IDA & IBRD countries)SudanSwedenSwitzerlandSyrian Arab RepublicTajikistanTanzaniaThailandTogoTrinidad and TobagoTunisiaTurkeyTurkmenistanUkraineUnited Arab EmiratesUnited KingdomUnited StatesUpper middle incomeUruguayUzbekistanVenezuela, RBVietnamWorldYemen, Rep.ZambiaZimbabwe Timeline:
This timeline shows a graph from 1972 to 2014 of Saudi Arabia. No data until 1971. Number of actual observations by date: 43.
Source name:
World Development Indicators
Source organization:
IEA Statistics © OECD/IEA 2014 (http://www.iea.org/stats/index.asp), subject to https://www.iea.org/t&c/termsandconditions/
Categories, topics:
Environment
Last updated:
apr 23, 2017
Indicators value changes by year
Maximum:
39.704
jan 1, 1981
At the date of observation
Value
Absolute change
Change from previous value
jan 1, 1972
15.549
+15.549
0.0%
jan 1, 1973
15.961
+0.413
2.65%
jan 1, 1974
20.9
+4.939
30.94%
jan 1, 1975
19.455
-1.444
-6.91%
jan 1, 1976
18.525
-0.93
-4.78%
jan 1, 1977
15.135
-3.39
-18.3%
jan 1, 1978
15.974
+0.839
5.55%
jan 1, 1979
21.295
+5.32
33.3%
jan 1, 1980
31.554
+10.259
48.18%
jan 1, 1981
39.704
+8.15
25.83%
jan 1, 1982
37.928
-1.776
-4.47%
jan 1, 1983
35.71
-2.218
-5.85%
jan 1, 1984
30.787
-4.923
-13.79%
jan 1, 1985
12.34
-18.447
-59.92%
jan 1, 1986
10.978
-1.362
-11.04%
jan 1, 1987
10.94
-0.038
-0.34%
jan 1, 1988
9.71
-1.23
-11.24%
jan 1, 1989
10.228
+0.517
5.33%
jan 1, 1990
10.876
+0.648
6.34%
jan 1, 1991
18.639
+7.763
71.38%
jan 1, 1992
17.906
-0.734
-3.94%
jan 1, 1993
18.89
+0.984
5.5%
jan 1, 1994
17.368
-1.522
-8.06%
jan 1, 1995
19.516
+2.148
12.37%
jan 1, 1996
20.875
+1.359
6.96%
jan 1, 1997
22.625
+1.751
8.39%
jan 1, 1998
20.371
-2.254
-9.96%
jan 1, 1999
22.265
+1.893
9.29%
jan 1, 2000
23.144
+0.879
3.95%
jan 1, 2001
22.543
-0.6
-2.59%
jan 1, 2002
21.936
-0.608
-2.69%
jan 1, 2003
23.513
+1.577
7.19%
jan 1, 2004
23.382
-0.131
-0.56%
jan 1, 2005
23.33
-0.052
-0.22%
jan 1, 2006
22.738
-0.592
-2.54%
jan 1, 2007
23.142
+0.404
1.78%
jan 1, 2008
23.99
+0.848
3.66%
jan 1, 2009
24.486
+0.497
2.07%
jan 1, 2010
23.991
-0.496
-2.03%
jan 1, 2011
26.662
+2.671
11.14%
jan 1, 2012
25.511
-1.151
-4.32%
jan 1, 2013
25.031
-0.48
-1.88%
jan 1, 2014
24.645
-0.386
-1.54%
Ranking of countries by current statistics by years


Comments: