29
/
en
AIzaSyAYiBZKx7MnpbEhh9jyipgxe19OcubqV5w
April 1, 2024
248445
Sri Lanka
LKA
true
2
1
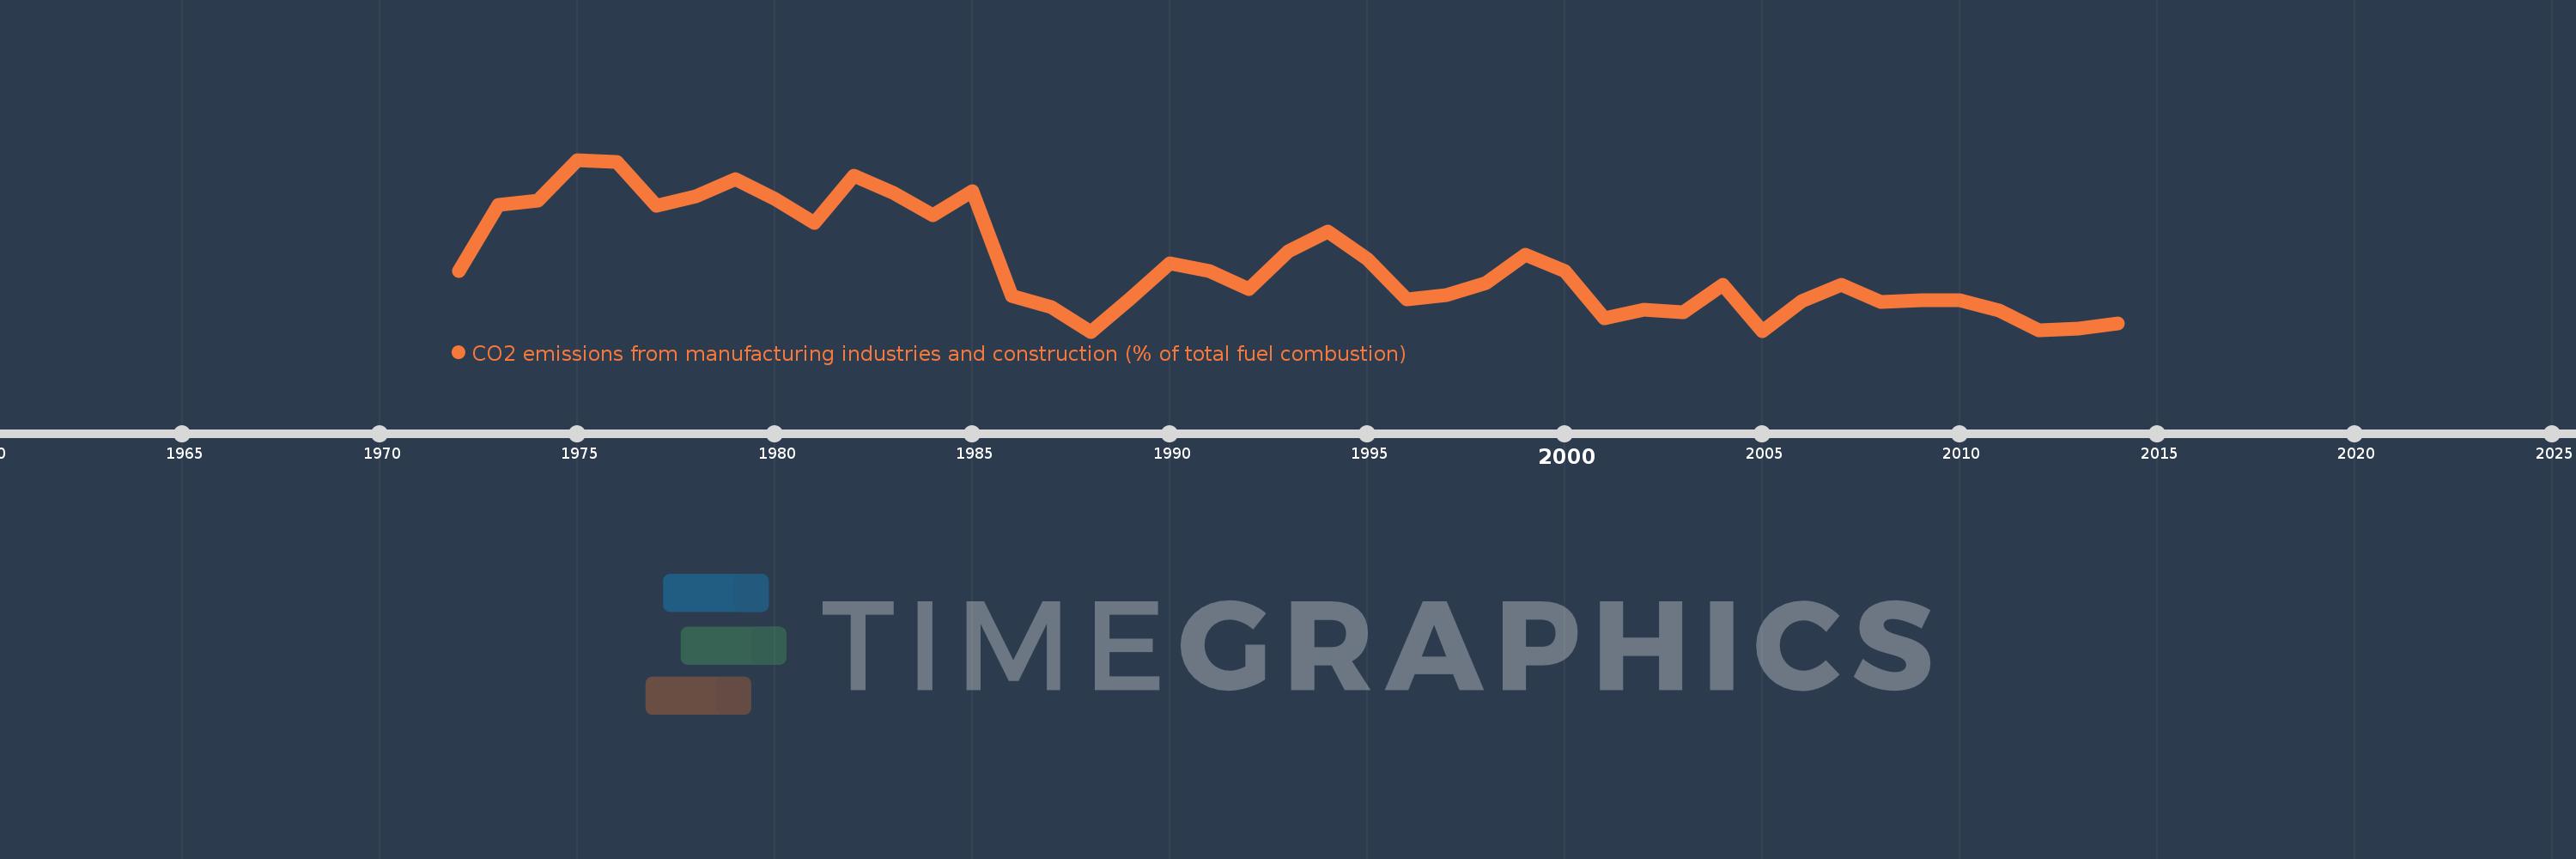
CO2 emissions from manufacturing industries and construction (% of total fuel combustion)
2014,2013,2012,2011,2010,2009,2008,2007,2006,2005,2004,2003,2002,2001,2000,1999,1998,1997,1996,1995,1994,1993,1992,1991,1990,1989,1988,1987,1986,1985,1984,1983,1982,1981,1980,1979,1978,1977,1976,1975,1974,1973,1972
This statistics in other country:
AlbaniaAlgeriaAngolaArab WorldArgentinaArmeniaAustraliaAustriaAzerbaijanBahrainBangladeshBelarusBelgiumBeninBoliviaBosnia and HerzegovinaBotswanaBrazilBrunei DarussalamBulgariaCambodiaCameroonCanadaCaribbean small statesCentral Europe and the BalticsChileChinaColombiaCongo, Dem. Rep.Congo, Rep.Costa RicaCote d'IvoireCroatiaCubaCuracaoCyprusCzech RepublicDenmarkDominican RepublicEarly-demographic dividendEast Asia & PacificEast Asia & Pacific (excluding high income)East Asia & Pacific (IDA & IBRD countries)EcuadorEgypt, Arab Rep.El SalvadorEritreaEstoniaEthiopiaEuro areaEurope & Central AsiaEurope & Central Asia (excluding high income)Europe & Central Asia (IDA & IBRD countries)European UnionFinlandFragile and conflict affected situationsFranceGabonGeorgiaGermanyGhanaGibraltarGreeceGuatemalaHaitiHeavily indebted poor countries (HIPC)High incomeHondurasHong Kong SAR, ChinaHungaryIBRD onlyIcelandIDA & IBRD totalIDA blendIDA onlyIDA totalIndiaIndonesiaIran, Islamic Rep.IraqIrelandIsraelItalyJamaicaJapanJordanKazakhstanKenyaKorea, Dem. People’s Rep.Korea, Rep.KosovoKuwaitKyrgyz RepublicLate-demographic dividendLatin America & Caribbean Latin America & Caribbean (excluding high income)Latin America & the Caribbean (IDA & IBRD countries)LatviaLeast developed countries: UN classificationLebanonLibyaLithuaniaLow & middle incomeLow incomeLower middle incomeLuxembourgMacedonia, FYRMalaysiaMaltaMauritiusMexicoMiddle East & North AfricaMiddle East & North Africa (excluding high income)Middle East & North Africa (IDA & IBRD countries)Middle incomeMoldovaMongoliaMontenegroMoroccoMozambiqueMyanmarNamibiaNepalNetherlandsNew ZealandNicaraguaNigerNigeriaNorth AmericaNorwayOECD membersOmanOther small statesPakistanPanamaParaguayPeruPhilippinesPolandPortugalPost-demographic dividendPre-demographic dividendQatarRomaniaRussian FederationSaudi ArabiaSenegalSerbiaSingaporeSlovak RepublicSloveniaSmall statesSouth AfricaSouth AsiaSouth Asia (IDA & IBRD)South SudanSpainSri LankaSub-Saharan Africa Sub-Saharan Africa (excluding high income)Sub-Saharan Africa (IDA & IBRD countries)SudanSwedenSwitzerlandSyrian Arab RepublicTajikistanTanzaniaThailandTogoTrinidad and TobagoTunisiaTurkeyTurkmenistanUkraineUnited Arab EmiratesUnited KingdomUnited StatesUpper middle incomeUruguayUzbekistanVenezuela, RBVietnamWorldYemen, Rep.ZambiaZimbabwe Timeline:
This timeline shows a graph from 1972 to 2014 of Sri Lanka. No data until 1971. Number of actual observations by date: 43.
Source name:
World Development Indicators
Source organization:
IEA Statistics © OECD/IEA 2014 (http://www.iea.org/stats/index.asp), subject to https://www.iea.org/t&c/termsandconditions/
Categories, topics:
Environment
Last updated:
apr 23, 2017
Indicators value changes by year
Maximum:
18.339
jan 1, 1975
At the date of observation
Value
Absolute change
Change from previous value
jan 1, 1972
10.87
+10.87
0.0%
jan 1, 1973
15.339
+4.47
41.12%
jan 1, 1974
15.581
+0.242
1.57%
jan 1, 1975
18.339
+2.758
17.7%
jan 1, 1976
18.182
-0.157
-0.86%
jan 1, 1977
15.242
-2.94
-16.17%
jan 1, 1978
15.862
+0.62
4.07%
jan 1, 1979
17.066
+1.204
7.59%
jan 1, 1980
15.746
-1.32
-7.73%
jan 1, 1981
14.088
-1.657
-10.53%
jan 1, 1982
17.287
+3.199
22.71%
jan 1, 1983
16.114
-1.173
-6.79%
jan 1, 1984
14.64
-1.474
-9.15%
jan 1, 1985
16.23
+1.591
10.87%
jan 1, 1986
9.195
-7.035
-43.34%
jan 1, 1987
8.455
-0.741
-8.05%
jan 1, 1988
6.818
-1.637
-19.36%
jan 1, 1989
9.019
+2.2
32.27%
jan 1, 1990
11.421
+2.402
26.63%
jan 1, 1991
10.899
-0.521
-4.57%
jan 1, 1992
9.686
-1.213
-11.13%
jan 1, 1993
12.22
+2.534
26.16%
jan 1, 1994
13.514
+1.294
10.59%
jan 1, 1995
11.688
-1.825
-13.51%
jan 1, 1996
8.991
-2.697
-23.08%
jan 1, 1997
9.273
+0.282
3.14%
jan 1, 1998
10.063
+0.79
8.52%
jan 1, 1999
12.0
+1.937
19.25%
jan 1, 2000
10.879
-1.121
-9.34%
jan 1, 2001
7.7
-3.18
-29.23%
jan 1, 2002
8.269
+0.57
7.4%
jan 1, 2003
8.113
-0.156
-1.89%
jan 1, 2004
9.958
+1.845
22.74%
jan 1, 2005
6.824
-3.134
-31.48%
jan 1, 2006
8.887
+2.064
30.24%
jan 1, 2007
9.932
+1.045
11.76%
jan 1, 2008
8.817
-1.115
-11.23%
jan 1, 2009
8.911
+0.094
1.07%
jan 1, 2010
8.91
-0.001
-0.01%
jan 1, 2011
8.226
-0.684
-7.68%
jan 1, 2012
6.885
-1.341
-16.3%
jan 1, 2013
7.036
+0.151
2.2%
jan 1, 2014
7.351
+0.315
4.47%
Ranking of countries by current statistics by years


Comments: