29
/
en
AIzaSyAYiBZKx7MnpbEhh9jyipgxe19OcubqV5w
April 1, 2024
267745
Tunisia
TUN
true
2
1
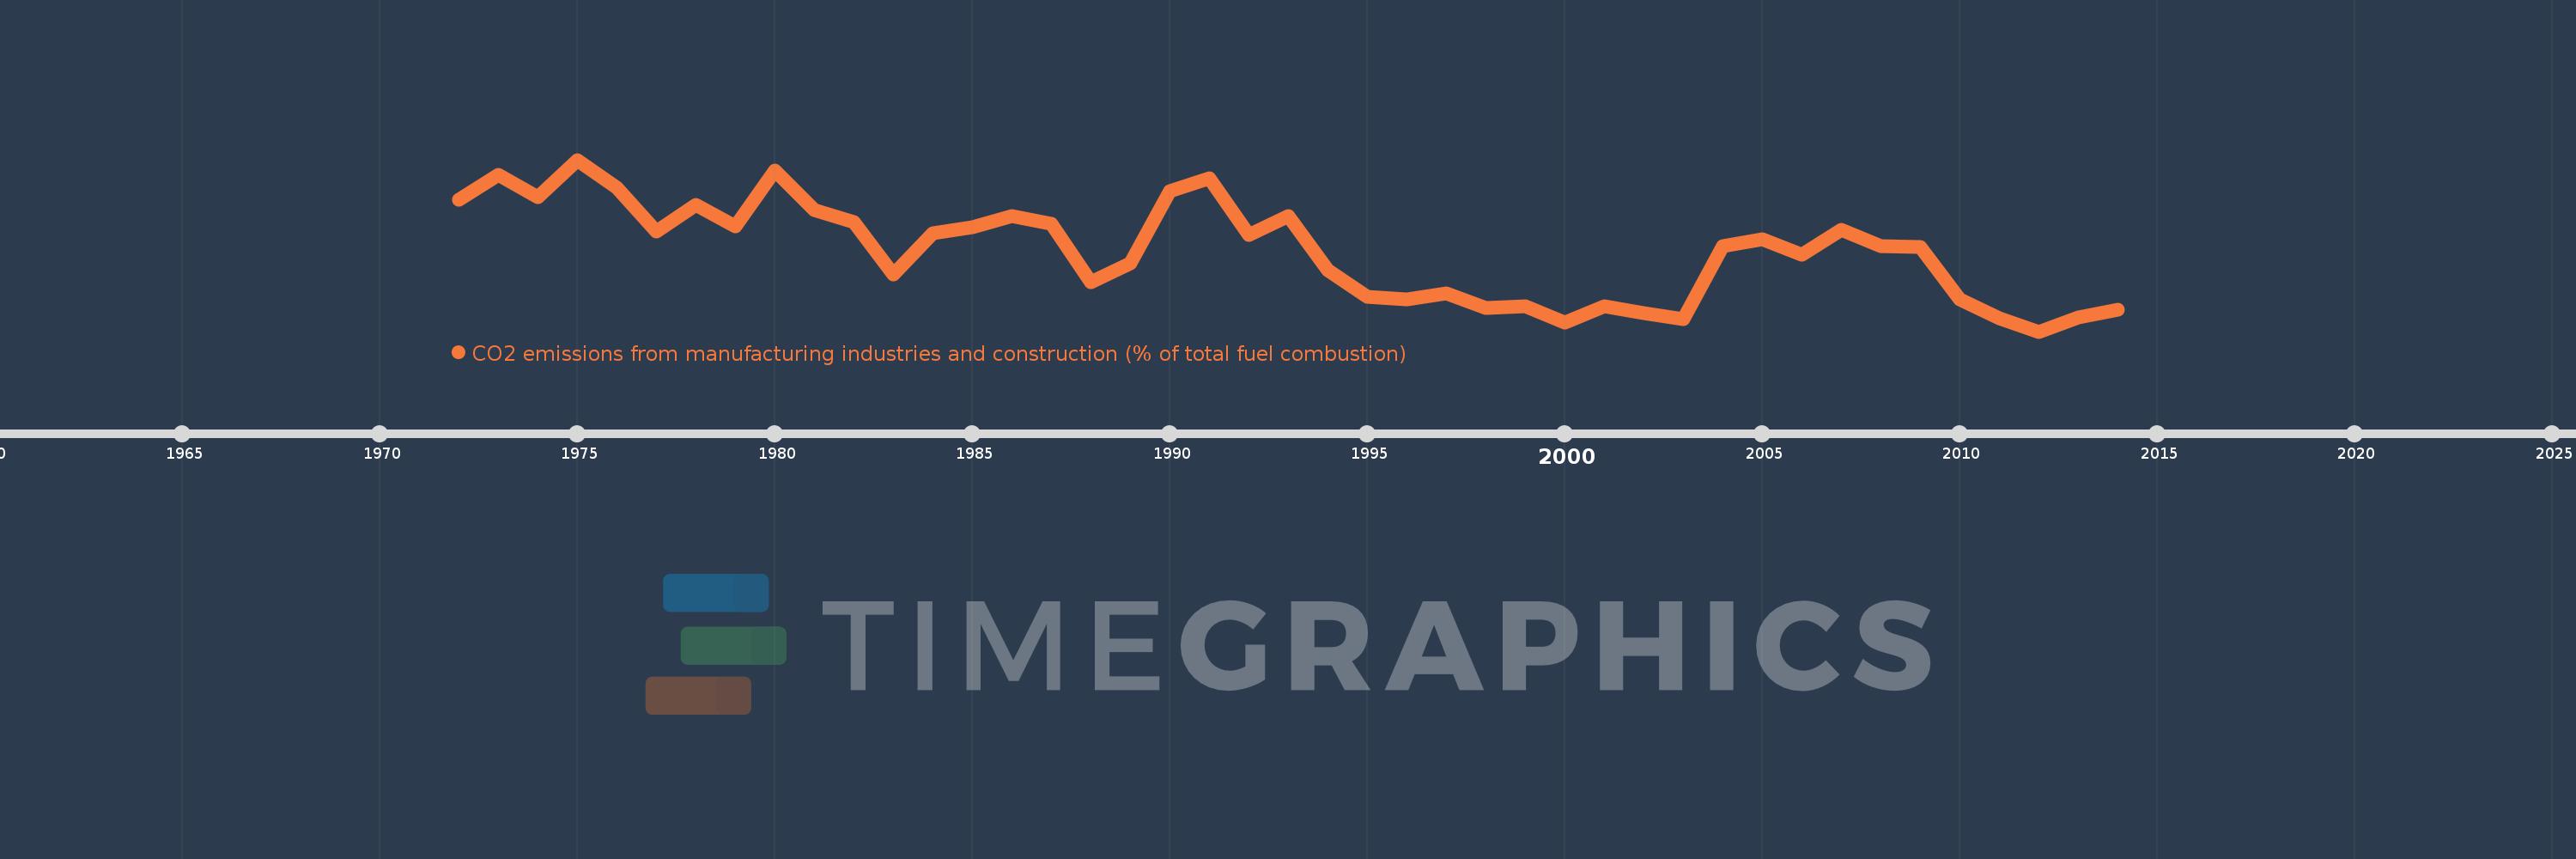
CO2 emissions from manufacturing industries and construction (% of total fuel combustion)
2014,2013,2012,2011,2010,2009,2008,2007,2006,2005,2004,2003,2002,2001,2000,1999,1998,1997,1996,1995,1994,1993,1992,1991,1990,1989,1988,1987,1986,1985,1984,1983,1982,1981,1980,1979,1978,1977,1976,1975,1974,1973,1972
This statistics in other country:
AlbaniaAlgeriaAngolaArab WorldArgentinaArmeniaAustraliaAustriaAzerbaijanBahrainBangladeshBelarusBelgiumBeninBoliviaBosnia and HerzegovinaBotswanaBrazilBrunei DarussalamBulgariaCambodiaCameroonCanadaCaribbean small statesCentral Europe and the BalticsChileChinaColombiaCongo, Dem. Rep.Congo, Rep.Costa RicaCote d'IvoireCroatiaCubaCuracaoCyprusCzech RepublicDenmarkDominican RepublicEarly-demographic dividendEast Asia & PacificEast Asia & Pacific (excluding high income)East Asia & Pacific (IDA & IBRD countries)EcuadorEgypt, Arab Rep.El SalvadorEritreaEstoniaEthiopiaEuro areaEurope & Central AsiaEurope & Central Asia (excluding high income)Europe & Central Asia (IDA & IBRD countries)European UnionFinlandFragile and conflict affected situationsFranceGabonGeorgiaGermanyGhanaGibraltarGreeceGuatemalaHaitiHeavily indebted poor countries (HIPC)High incomeHondurasHong Kong SAR, ChinaHungaryIBRD onlyIcelandIDA & IBRD totalIDA blendIDA onlyIDA totalIndiaIndonesiaIran, Islamic Rep.IraqIrelandIsraelItalyJamaicaJapanJordanKazakhstanKenyaKorea, Dem. People’s Rep.Korea, Rep.KosovoKuwaitKyrgyz RepublicLate-demographic dividendLatin America & Caribbean Latin America & Caribbean (excluding high income)Latin America & the Caribbean (IDA & IBRD countries)LatviaLeast developed countries: UN classificationLebanonLibyaLithuaniaLow & middle incomeLow incomeLower middle incomeLuxembourgMacedonia, FYRMalaysiaMaltaMauritiusMexicoMiddle East & North AfricaMiddle East & North Africa (excluding high income)Middle East & North Africa (IDA & IBRD countries)Middle incomeMoldovaMongoliaMontenegroMoroccoMozambiqueMyanmarNamibiaNepalNetherlandsNew ZealandNicaraguaNigerNigeriaNorth AmericaNorwayOECD membersOmanOther small statesPakistanPanamaParaguayPeruPhilippinesPolandPortugalPost-demographic dividendPre-demographic dividendQatarRomaniaRussian FederationSaudi ArabiaSenegalSerbiaSingaporeSlovak RepublicSloveniaSmall statesSouth AfricaSouth AsiaSouth Asia (IDA & IBRD)South SudanSpainSri LankaSub-Saharan Africa Sub-Saharan Africa (excluding high income)Sub-Saharan Africa (IDA & IBRD countries)SudanSwedenSwitzerlandSyrian Arab RepublicTajikistanTanzaniaThailandTogoTrinidad and TobagoTunisiaTurkeyTurkmenistanUkraineUnited Arab EmiratesUnited KingdomUnited StatesUpper middle incomeUruguayUzbekistanVenezuela, RBVietnamWorldYemen, Rep.ZambiaZimbabwe Timeline:
This timeline shows a graph from 1972 to 2014 of Tunisia. No data until 1971. Number of actual observations by date: 43.
Source name:
World Development Indicators
Source organization:
IEA Statistics © OECD/IEA 2014 (http://www.iea.org/stats/index.asp), subject to https://www.iea.org/t&c/termsandconditions/
Categories, topics:
Environment
Last updated:
apr 23, 2017
Indicators value changes by year
Minimum:
19.065
jan 1, 2012
At the date of observation
Value
Absolute change
Change from previous value
jan 1, 1972
26.613
+26.613
0.0%
jan 1, 1973
28.019
+1.406
5.28%
jan 1, 1974
26.714
-1.305
-4.66%
jan 1, 1975
28.87
+2.156
8.07%
jan 1, 1976
27.273
-1.598
-5.53%
jan 1, 1977
24.756
-2.516
-9.23%
jan 1, 1978
26.307
+1.55
6.26%
jan 1, 1979
25.08
-1.227
-4.66%
jan 1, 1980
28.279
+3.199
12.75%
jan 1, 1981
26.01
-2.269
-8.02%
jan 1, 1982
25.307
-0.703
-2.7%
jan 1, 1983
22.32
-2.987
-11.8%
jan 1, 1984
24.671
+2.351
10.53%
jan 1, 1985
25.0
+0.329
1.33%
jan 1, 1986
25.673
+0.673
2.69%
jan 1, 1987
25.202
-0.471
-1.84%
jan 1, 1988
21.866
-3.336
-13.24%
jan 1, 1989
22.963
+1.097
5.02%
jan 1, 1990
27.101
+4.138
18.02%
jan 1, 1991
27.81
+0.708
2.61%
jan 1, 1992
24.581
-3.229
-11.61%
jan 1, 1993
25.678
+1.097
4.46%
jan 1, 1994
22.555
-3.123
-12.16%
jan 1, 1995
21.03
-1.525
-6.76%
jan 1, 1996
20.884
-0.146
-0.69%
jan 1, 1997
21.259
+0.375
1.8%
jan 1, 1998
20.428
-0.831
-3.91%
jan 1, 1999
20.51
+0.082
0.4%
jan 1, 2000
19.597
-0.912
-4.45%
jan 1, 2001
20.533
+0.936
4.78%
jan 1, 2002
20.108
-0.425
-2.07%
jan 1, 2003
19.762
-0.346
-1.72%
jan 1, 2004
23.95
+4.187
21.19%
jan 1, 2005
24.317
+0.367
1.53%
jan 1, 2006
23.472
-0.845
-3.48%
jan 1, 2007
24.851
+1.379
5.88%
jan 1, 2008
23.939
-0.912
-3.67%
jan 1, 2009
23.895
-0.043
-0.18%
jan 1, 2010
20.918
-2.977
-12.46%
jan 1, 2011
19.837
-1.081
-5.17%
jan 1, 2012
19.065
-0.772
-3.89%
jan 1, 2013
19.855
+0.79
4.15%
jan 1, 2014
20.296
+0.441
2.22%
Ranking of countries by current statistics by years


Comments: