29
/
en
AIzaSyAYiBZKx7MnpbEhh9jyipgxe19OcubqV5w
April 1, 2024
179810
Libya
LBY
true
2
1
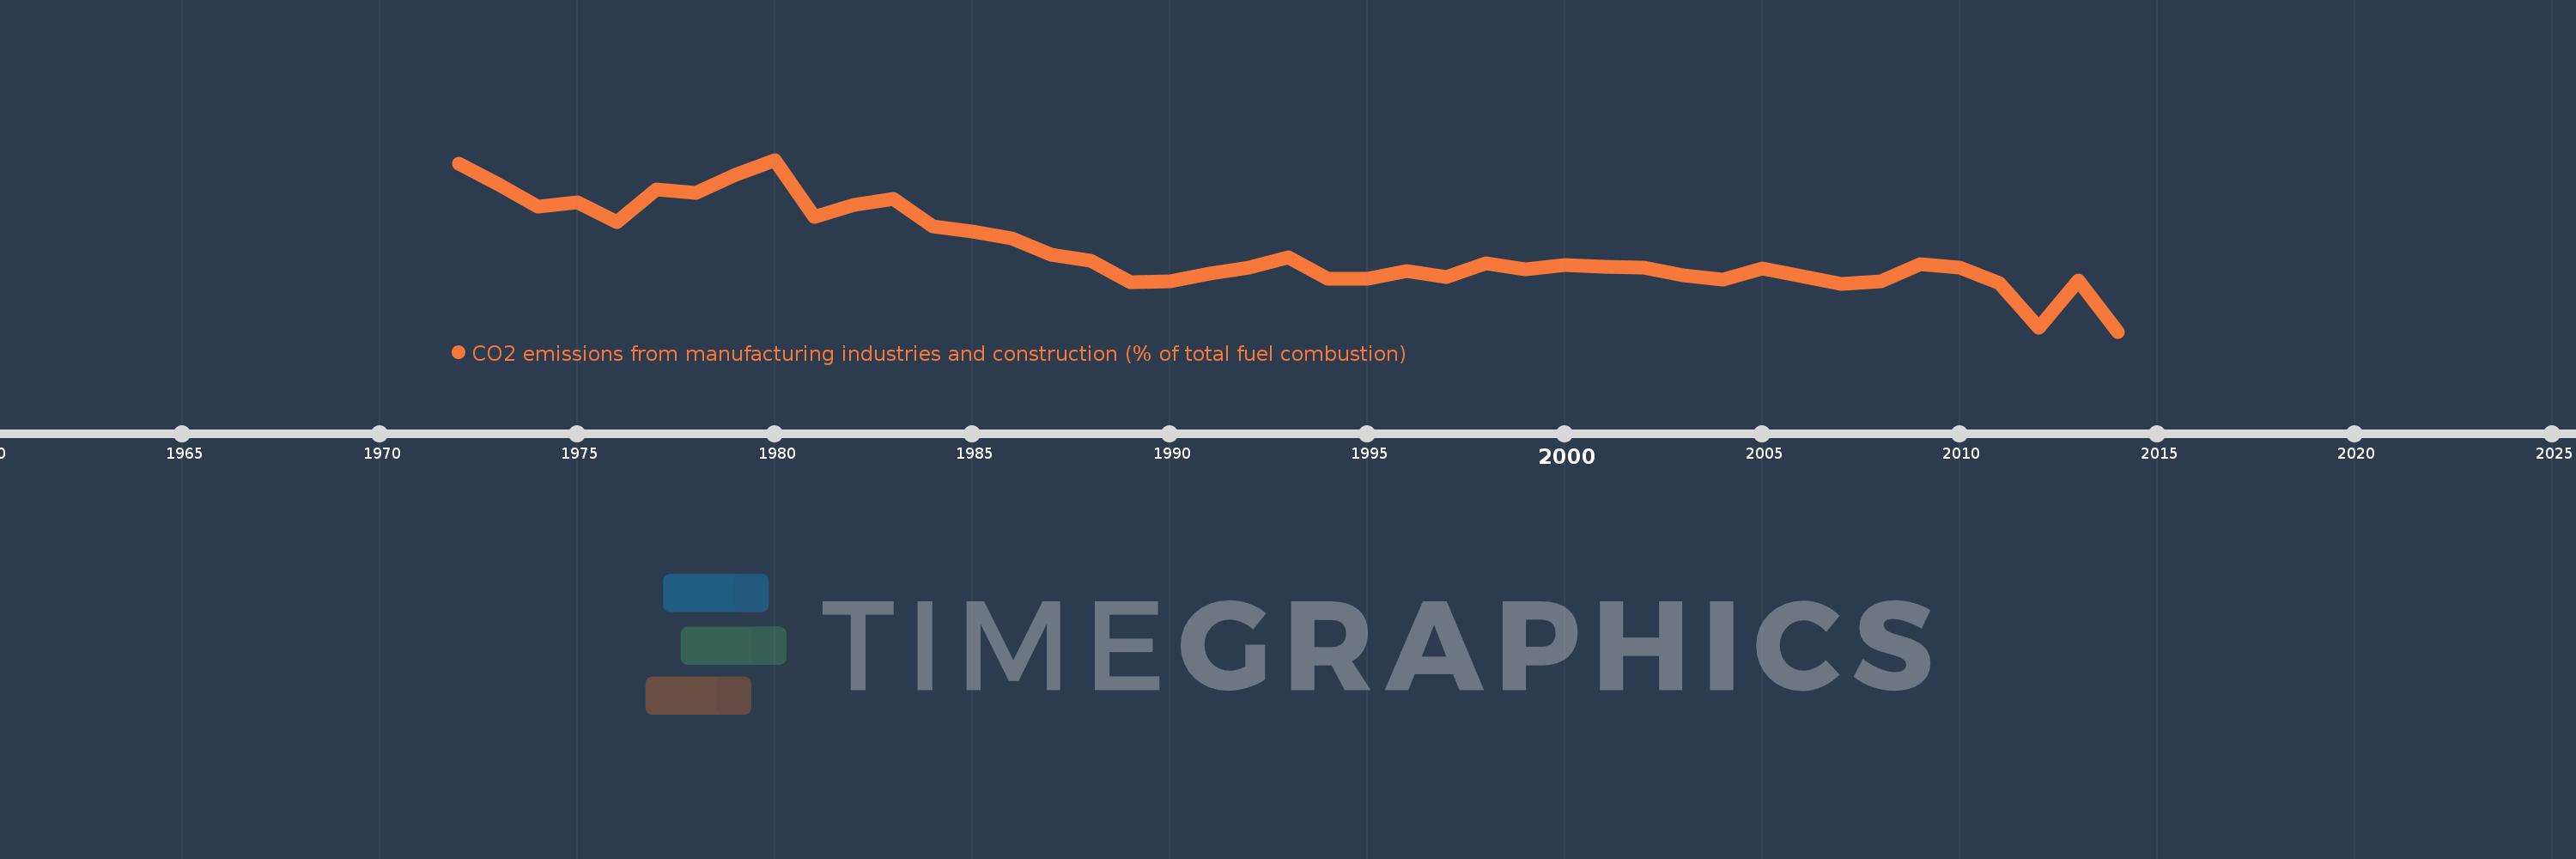
CO2 emissions from manufacturing industries and construction (% of total fuel combustion)
2014,2013,2012,2011,2010,2009,2008,2007,2006,2005,2004,2003,2002,2001,2000,1999,1998,1997,1996,1995,1994,1993,1992,1991,1990,1989,1988,1987,1986,1985,1984,1983,1982,1981,1980,1979,1978,1977,1976,1975,1974,1973,1972
This statistics in other country:
AlbaniaAlgeriaAngolaArab WorldArgentinaArmeniaAustraliaAustriaAzerbaijanBahrainBangladeshBelarusBelgiumBeninBoliviaBosnia and HerzegovinaBotswanaBrazilBrunei DarussalamBulgariaCambodiaCameroonCanadaCaribbean small statesCentral Europe and the BalticsChileChinaColombiaCongo, Dem. Rep.Congo, Rep.Costa RicaCote d'IvoireCroatiaCubaCuracaoCyprusCzech RepublicDenmarkDominican RepublicEarly-demographic dividendEast Asia & PacificEast Asia & Pacific (excluding high income)East Asia & Pacific (IDA & IBRD countries)EcuadorEgypt, Arab Rep.El SalvadorEritreaEstoniaEthiopiaEuro areaEurope & Central AsiaEurope & Central Asia (excluding high income)Europe & Central Asia (IDA & IBRD countries)European UnionFinlandFragile and conflict affected situationsFranceGabonGeorgiaGermanyGhanaGibraltarGreeceGuatemalaHaitiHeavily indebted poor countries (HIPC)High incomeHondurasHong Kong SAR, ChinaHungaryIBRD onlyIcelandIDA & IBRD totalIDA blendIDA onlyIDA totalIndiaIndonesiaIran, Islamic Rep.IraqIrelandIsraelItalyJamaicaJapanJordanKazakhstanKenyaKorea, Dem. People’s Rep.Korea, Rep.KosovoKuwaitKyrgyz RepublicLate-demographic dividendLatin America & Caribbean Latin America & Caribbean (excluding high income)Latin America & the Caribbean (IDA & IBRD countries)LatviaLeast developed countries: UN classificationLebanonLibyaLithuaniaLow & middle incomeLow incomeLower middle incomeLuxembourgMacedonia, FYRMalaysiaMaltaMauritiusMexicoMiddle East & North AfricaMiddle East & North Africa (excluding high income)Middle East & North Africa (IDA & IBRD countries)Middle incomeMoldovaMongoliaMontenegroMoroccoMozambiqueMyanmarNamibiaNepalNetherlandsNew ZealandNicaraguaNigerNigeriaNorth AmericaNorwayOECD membersOmanOther small statesPakistanPanamaParaguayPeruPhilippinesPolandPortugalPost-demographic dividendPre-demographic dividendQatarRomaniaRussian FederationSaudi ArabiaSenegalSerbiaSingaporeSlovak RepublicSloveniaSmall statesSouth AfricaSouth AsiaSouth Asia (IDA & IBRD)South SudanSpainSri LankaSub-Saharan Africa Sub-Saharan Africa (excluding high income)Sub-Saharan Africa (IDA & IBRD countries)SudanSwedenSwitzerlandSyrian Arab RepublicTajikistanTanzaniaThailandTogoTrinidad and TobagoTunisiaTurkeyTurkmenistanUkraineUnited Arab EmiratesUnited KingdomUnited StatesUpper middle incomeUruguayUzbekistanVenezuela, RBVietnamWorldYemen, Rep.ZambiaZimbabwe Timeline:
This timeline shows a graph from 1972 to 2014 of Libya. No data until 1971. Number of actual observations by date: 43.
Source name:
World Development Indicators
Source organization:
IEA Statistics © OECD/IEA 2014 (http://www.iea.org/stats/index.asp), subject to https://www.iea.org/t&c/termsandconditions/
Categories, topics:
Environment
Last updated:
apr 23, 2017
Indicators value changes by year
Maximum:
17.835
jan 1, 1980
At the date of observation
Value
Absolute change
Change from previous value
jan 1, 1972
17.473
+17.473
0.0%
jan 1, 1973
15.741
-1.732
-9.91%
jan 1, 1974
13.841
-1.9
-12.07%
jan 1, 1975
14.159
+0.318
2.3%
jan 1, 1976
12.457
-1.703
-12.02%
jan 1, 1977
15.293
+2.836
22.77%
jan 1, 1978
14.995
-0.298
-1.95%
jan 1, 1979
16.527
+1.532
10.21%
jan 1, 1980
17.835
+1.308
7.91%
jan 1, 1981
12.969
-4.866
-27.28%
jan 1, 1982
13.932
+0.962
7.42%
jan 1, 1983
14.467
+0.535
3.84%
jan 1, 1984
12.132
-2.335
-16.14%
jan 1, 1985
11.715
-0.416
-3.43%
jan 1, 1986
11.064
-0.651
-5.56%
jan 1, 1987
9.67
-1.394
-12.6%
jan 1, 1988
9.147
-0.523
-5.41%
jan 1, 1989
7.308
-1.839
-20.1%
jan 1, 1990
7.396
+0.088
1.2%
jan 1, 1991
8.053
+0.656
8.87%
jan 1, 1992
8.574
+0.521
6.47%
jan 1, 1993
9.445
+0.871
10.16%
jan 1, 1994
7.6
-1.845
-19.53%
jan 1, 1995
7.616
+0.016
0.2%
jan 1, 1996
8.318
+0.702
9.22%
jan 1, 1997
7.792
-0.526
-6.33%
jan 1, 1998
8.97
+1.178
15.12%
jan 1, 1999
8.444
-0.527
-5.87%
jan 1, 2000
8.816
+0.372
4.41%
jan 1, 2001
8.651
-0.165
-1.87%
jan 1, 2002
8.588
-0.063
-0.73%
jan 1, 2003
7.919
-0.669
-7.8%
jan 1, 2004
7.546
-0.373
-4.71%
jan 1, 2005
8.542
+0.996
13.2%
jan 1, 2006
7.855
-0.687
-8.04%
jan 1, 2007
7.194
-0.661
-8.41%
jan 1, 2008
7.396
+0.202
2.81%
jan 1, 2009
8.911
+1.515
20.49%
jan 1, 2010
8.559
-0.352
-3.95%
jan 1, 2011
7.256
-1.303
-15.22%
jan 1, 2012
3.446
-3.81
-52.5%
jan 1, 2013
7.515
+4.068
118.05%
jan 1, 2014
3.1
-4.415
-58.75%
Ranking of countries by current statistics by years


Comments: