29
/
en
AIzaSyAYiBZKx7MnpbEhh9jyipgxe19OcubqV5w
April 1, 2024
93327
Bulgaria
BGR
true
2
1
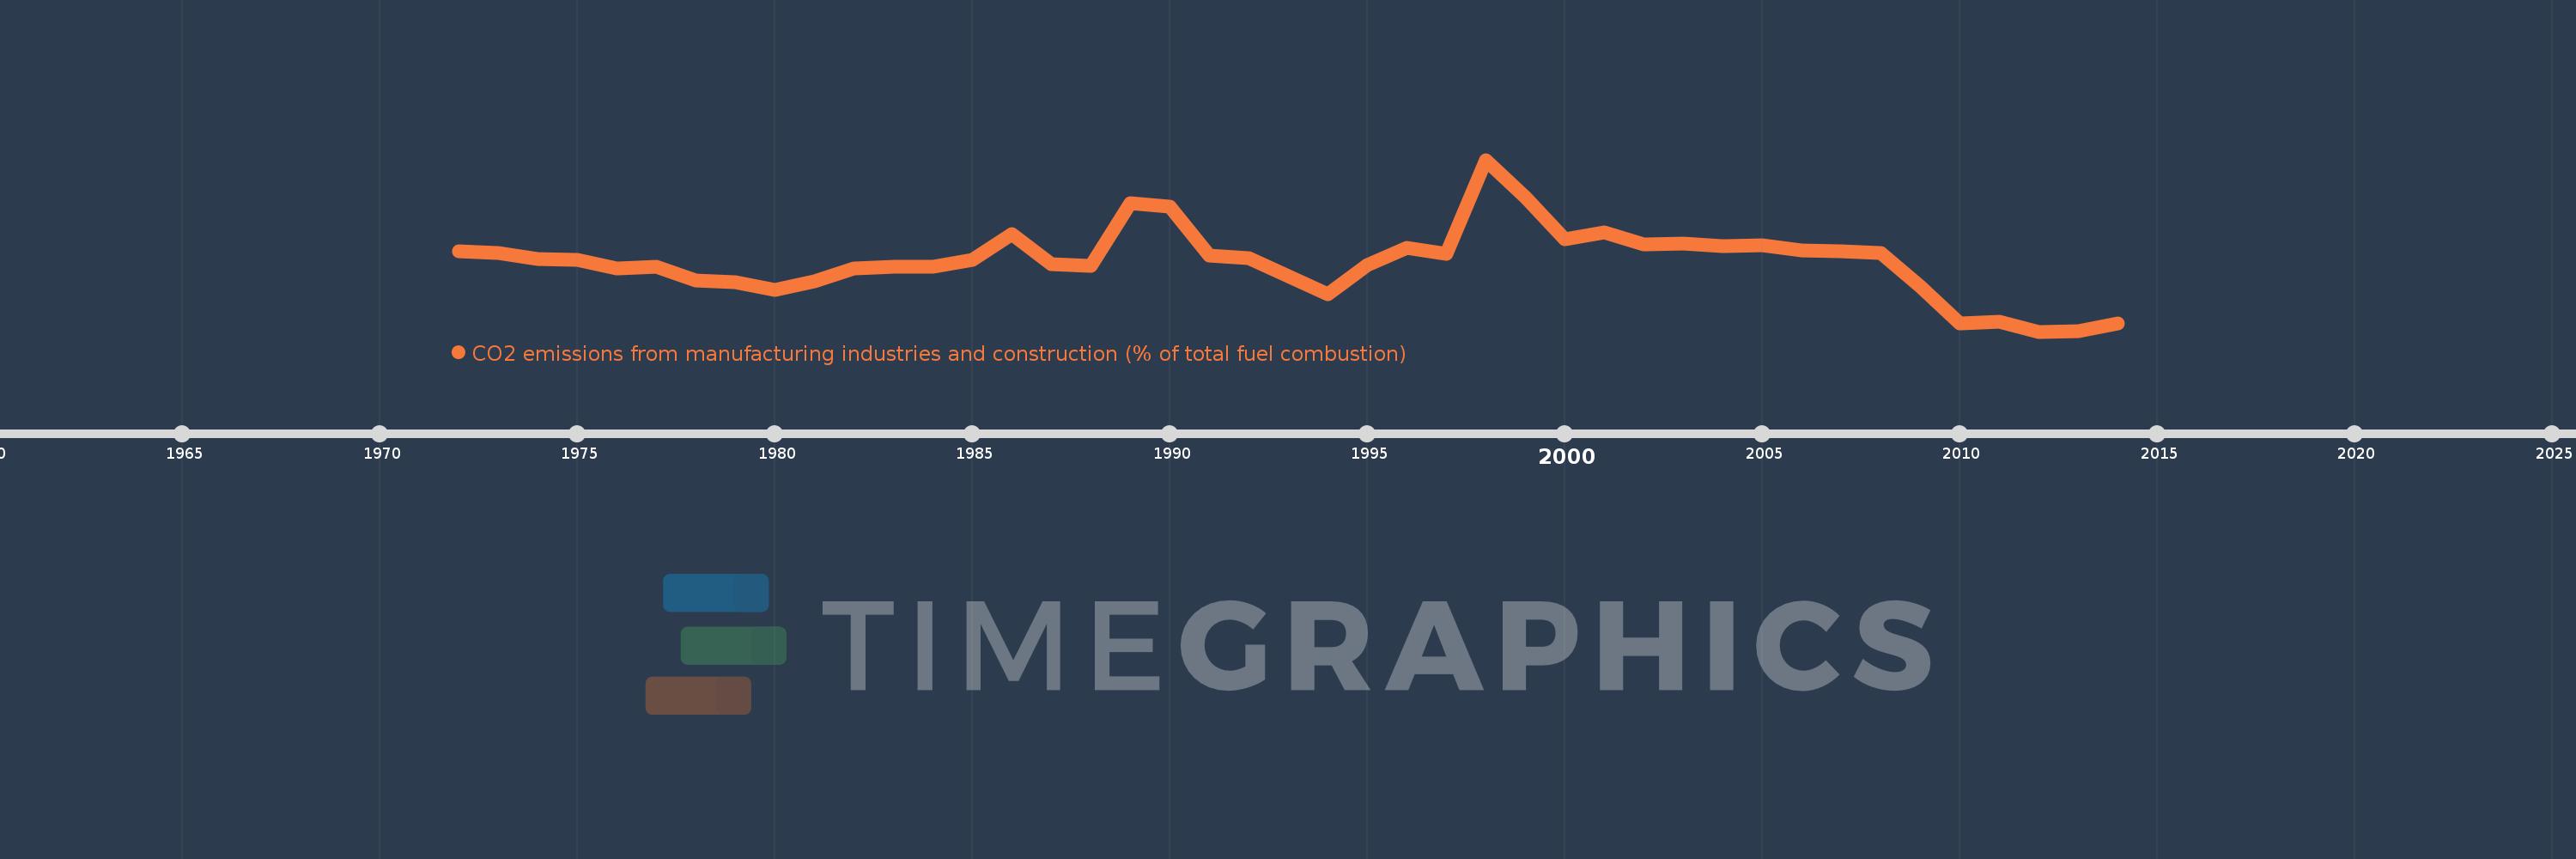
CO2 emissions from manufacturing industries and construction (% of total fuel combustion)
2014,2013,2012,2011,2010,2009,2008,2007,2006,2005,2004,2003,2002,2001,2000,1999,1998,1997,1996,1995,1994,1993,1992,1991,1990,1989,1988,1987,1986,1985,1984,1983,1982,1981,1980,1979,1978,1977,1976,1975,1974,1973,1972
This statistics in other country:
AlbaniaAlgeriaAngolaArab WorldArgentinaArmeniaAustraliaAustriaAzerbaijanBahrainBangladeshBelarusBelgiumBeninBoliviaBosnia and HerzegovinaBotswanaBrazilBrunei DarussalamBulgariaCambodiaCameroonCanadaCaribbean small statesCentral Europe and the BalticsChileChinaColombiaCongo, Dem. Rep.Congo, Rep.Costa RicaCote d'IvoireCroatiaCubaCuracaoCyprusCzech RepublicDenmarkDominican RepublicEarly-demographic dividendEast Asia & PacificEast Asia & Pacific (excluding high income)East Asia & Pacific (IDA & IBRD countries)EcuadorEgypt, Arab Rep.El SalvadorEritreaEstoniaEthiopiaEuro areaEurope & Central AsiaEurope & Central Asia (excluding high income)Europe & Central Asia (IDA & IBRD countries)European UnionFinlandFragile and conflict affected situationsFranceGabonGeorgiaGermanyGhanaGibraltarGreeceGuatemalaHaitiHeavily indebted poor countries (HIPC)High incomeHondurasHong Kong SAR, ChinaHungaryIBRD onlyIcelandIDA & IBRD totalIDA blendIDA onlyIDA totalIndiaIndonesiaIran, Islamic Rep.IraqIrelandIsraelItalyJamaicaJapanJordanKazakhstanKenyaKorea, Dem. People’s Rep.Korea, Rep.KosovoKuwaitKyrgyz RepublicLate-demographic dividendLatin America & Caribbean Latin America & Caribbean (excluding high income)Latin America & the Caribbean (IDA & IBRD countries)LatviaLeast developed countries: UN classificationLebanonLibyaLithuaniaLow & middle incomeLow incomeLower middle incomeLuxembourgMacedonia, FYRMalaysiaMaltaMauritiusMexicoMiddle East & North AfricaMiddle East & North Africa (excluding high income)Middle East & North Africa (IDA & IBRD countries)Middle incomeMoldovaMongoliaMontenegroMoroccoMozambiqueMyanmarNamibiaNepalNetherlandsNew ZealandNicaraguaNigerNigeriaNorth AmericaNorwayOECD membersOmanOther small statesPakistanPanamaParaguayPeruPhilippinesPolandPortugalPost-demographic dividendPre-demographic dividendQatarRomaniaRussian FederationSaudi ArabiaSenegalSerbiaSingaporeSlovak RepublicSloveniaSmall statesSouth AfricaSouth AsiaSouth Asia (IDA & IBRD)South SudanSpainSri LankaSub-Saharan Africa Sub-Saharan Africa (excluding high income)Sub-Saharan Africa (IDA & IBRD countries)SudanSwedenSwitzerlandSyrian Arab RepublicTajikistanTanzaniaThailandTogoTrinidad and TobagoTunisiaTurkeyTurkmenistanUkraineUnited Arab EmiratesUnited KingdomUnited StatesUpper middle incomeUruguayUzbekistanVenezuela, RBVietnamWorldYemen, Rep.ZambiaZimbabwe Timeline:
This timeline shows a graph from 1972 to 2014 of Bulgaria. No data until 1971. Number of actual observations by date: 43.
Source name:
World Development Indicators
Source organization:
IEA Statistics © OECD/IEA 2014 (http://www.iea.org/stats/index.asp), subject to https://www.iea.org/t&c/termsandconditions/
Categories, topics:
Environment
Last updated:
apr 23, 2017
Indicators value changes by year
Maximum:
27.505
jan 1, 1998
At the date of observation
Value
Absolute change
Change from previous value
jan 1, 1972
16.776
+16.776
0.0%
jan 1, 1973
16.515
-0.261
-1.56%
jan 1, 1974
15.855
-0.66
-4.0%
jan 1, 1975
15.758
-0.097
-0.61%
jan 1, 1976
14.73
-1.028
-6.52%
jan 1, 1977
14.918
+0.188
1.28%
jan 1, 1978
13.362
-1.556
-10.43%
jan 1, 1979
13.185
-0.177
-1.33%
jan 1, 1980
12.23
-0.955
-7.25%
jan 1, 1981
13.228
+0.998
8.16%
jan 1, 1982
14.777
+1.55
11.72%
jan 1, 1983
14.99
+0.213
1.44%
jan 1, 1984
14.945
-0.046
-0.3%
jan 1, 1985
15.718
+0.773
5.17%
jan 1, 1986
18.789
+3.071
19.54%
jan 1, 1987
15.23
-3.559
-18.94%
jan 1, 1988
15.003
-0.227
-1.49%
jan 1, 1989
22.409
+7.406
49.37%
jan 1, 1990
21.979
-0.431
-1.92%
jan 1, 1991
16.213
-5.766
-26.23%
jan 1, 1992
15.916
-0.297
-1.83%
jan 1, 1993
13.824
-2.092
-13.15%
jan 1, 1994
11.686
-2.138
-15.46%
jan 1, 1995
15.166
+3.48
29.78%
jan 1, 1996
17.179
+2.013
13.27%
jan 1, 1997
16.454
-0.725
-4.22%
jan 1, 1998
27.505
+11.051
67.17%
jan 1, 1999
23.093
-4.412
-16.04%
jan 1, 2000
18.216
-4.877
-21.12%
jan 1, 2001
18.962
+0.746
4.1%
jan 1, 2002
17.522
-1.44
-7.6%
jan 1, 2003
17.675
+0.153
0.87%
jan 1, 2004
17.355
-0.32
-1.81%
jan 1, 2005
17.511
+0.156
0.9%
jan 1, 2006
16.903
-0.608
-3.47%
jan 1, 2007
16.747
-0.156
-0.92%
jan 1, 2008
16.533
-0.214
-1.28%
jan 1, 2009
12.631
-3.901
-23.6%
jan 1, 2010
8.302
-4.329
-34.28%
jan 1, 2011
8.446
+0.144
1.74%
jan 1, 2012
7.336
-1.11
-13.14%
jan 1, 2013
7.379
+0.043
0.59%
jan 1, 2014
8.291
+0.912
12.36%
Ranking of countries by current statistics by years


Comments: