29
/
en
AIzaSyAYiBZKx7MnpbEhh9jyipgxe19OcubqV5w
April 1, 2024
181906
Luxembourg
LUX
true
2
1
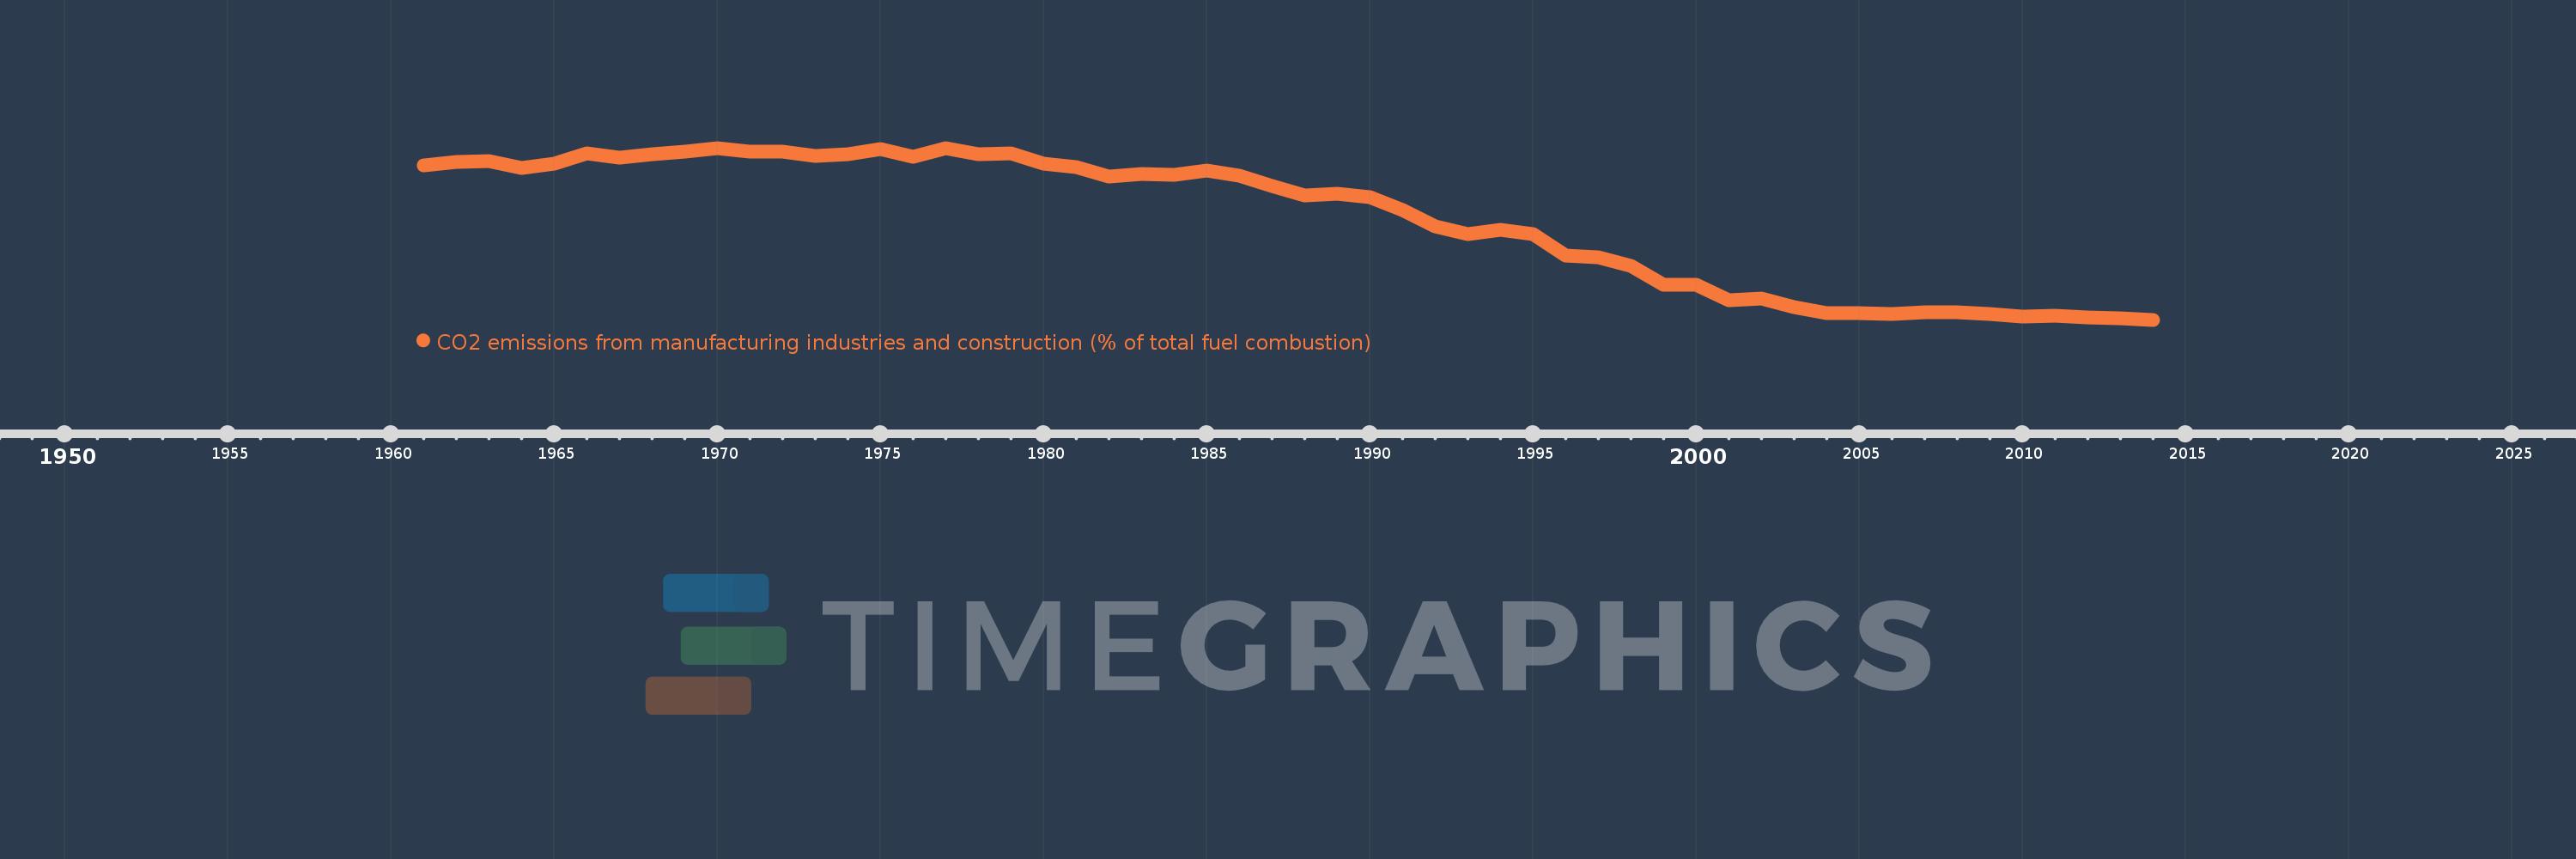
CO2 emissions from manufacturing industries and construction (% of total fuel combustion)
2014,2013,2012,2011,2010,2009,2008,2007,2006,2005,2004,2003,2002,2001,2000,1999,1998,1997,1996,1995,1994,1993,1992,1991,1990,1989,1988,1987,1986,1985,1984,1983,1982,1981,1980,1979,1978,1977,1976,1975,1974,1973,1972,1971,1970,1969,1968,1967,1966,1965,1964,1963,1962,1961
This statistics in other country:
AlbaniaAlgeriaAngolaArab WorldArgentinaArmeniaAustraliaAustriaAzerbaijanBahrainBangladeshBelarusBelgiumBeninBoliviaBosnia and HerzegovinaBotswanaBrazilBrunei DarussalamBulgariaCambodiaCameroonCanadaCaribbean small statesCentral Europe and the BalticsChileChinaColombiaCongo, Dem. Rep.Congo, Rep.Costa RicaCote d'IvoireCroatiaCubaCuracaoCyprusCzech RepublicDenmarkDominican RepublicEarly-demographic dividendEast Asia & PacificEast Asia & Pacific (excluding high income)East Asia & Pacific (IDA & IBRD countries)EcuadorEgypt, Arab Rep.El SalvadorEritreaEstoniaEthiopiaEuro areaEurope & Central AsiaEurope & Central Asia (excluding high income)Europe & Central Asia (IDA & IBRD countries)European UnionFinlandFragile and conflict affected situationsFranceGabonGeorgiaGermanyGhanaGibraltarGreeceGuatemalaHaitiHeavily indebted poor countries (HIPC)High incomeHondurasHong Kong SAR, ChinaHungaryIBRD onlyIcelandIDA & IBRD totalIDA blendIDA onlyIDA totalIndiaIndonesiaIran, Islamic Rep.IraqIrelandIsraelItalyJamaicaJapanJordanKazakhstanKenyaKorea, Dem. People’s Rep.Korea, Rep.KosovoKuwaitKyrgyz RepublicLate-demographic dividendLatin America & Caribbean Latin America & Caribbean (excluding high income)Latin America & the Caribbean (IDA & IBRD countries)LatviaLeast developed countries: UN classificationLebanonLibyaLithuaniaLow & middle incomeLow incomeLower middle incomeLuxembourgMacedonia, FYRMalaysiaMaltaMauritiusMexicoMiddle East & North AfricaMiddle East & North Africa (excluding high income)Middle East & North Africa (IDA & IBRD countries)Middle incomeMoldovaMongoliaMontenegroMoroccoMozambiqueMyanmarNamibiaNepalNetherlandsNew ZealandNicaraguaNigerNigeriaNorth AmericaNorwayOECD membersOmanOther small statesPakistanPanamaParaguayPeruPhilippinesPolandPortugalPost-demographic dividendPre-demographic dividendQatarRomaniaRussian FederationSaudi ArabiaSenegalSerbiaSingaporeSlovak RepublicSloveniaSmall statesSouth AfricaSouth AsiaSouth Asia (IDA & IBRD)South SudanSpainSri LankaSub-Saharan Africa Sub-Saharan Africa (excluding high income)Sub-Saharan Africa (IDA & IBRD countries)SudanSwedenSwitzerlandSyrian Arab RepublicTajikistanTanzaniaThailandTogoTrinidad and TobagoTunisiaTurkeyTurkmenistanUkraineUnited Arab EmiratesUnited KingdomUnited StatesUpper middle incomeUruguayUzbekistanVenezuela, RBVietnamWorldYemen, Rep.ZambiaZimbabwe Timeline:
This timeline shows a graph from 1961 to 2014 of Luxembourg. No data until 1960. Number of actual observations by date: 54.
Source name:
World Development Indicators
Source organization:
IEA Statistics © OECD/IEA 2014 (http://www.iea.org/stats/index.asp), subject to https://www.iea.org/t&c/termsandconditions/
Categories, topics:
Environment
Last updated:
apr 23, 2017
Indicators value changes by year
Maximum:
69.093
jan 1, 1970
At the date of observation
Value
Absolute change
Change from previous value
jan 1, 1961
62.894
+62.894
0.0%
jan 1, 1962
64.256
+1.362
2.17%
jan 1, 1963
64.325
+0.069
0.11%
jan 1, 1964
61.955
-2.37
-3.68%
jan 1, 1965
63.51
+1.555
2.51%
jan 1, 1966
67.251
+3.742
5.89%
jan 1, 1967
65.539
-1.712
-2.55%
jan 1, 1968
66.954
+1.415
2.16%
jan 1, 1969
67.73
+0.776
1.16%
jan 1, 1970
69.093
+1.363
2.01%
jan 1, 1971
67.873
-1.219
-1.76%
jan 1, 1972
67.842
-0.031
-0.05%
jan 1, 1973
66.335
-1.507
-2.22%
jan 1, 1974
66.839
+0.503
0.76%
jan 1, 1975
68.668
+1.829
2.74%
jan 1, 1976
65.907
-2.761
-4.02%
jan 1, 1977
68.966
+3.058
4.64%
jan 1, 1978
67.002
-1.964
-2.85%
jan 1, 1979
67.067
+0.066
0.1%
jan 1, 1980
63.472
-3.595
-5.36%
jan 1, 1981
62.299
-1.173
-1.85%
jan 1, 1982
59.164
-3.135
-5.03%
jan 1, 1983
59.98
+0.815
1.38%
jan 1, 1984
59.48
-0.5
-0.83%
jan 1, 1985
61.089
+1.609
2.71%
jan 1, 1986
59.439
-1.651
-2.7%
jan 1, 1987
55.744
-3.694
-6.22%
jan 1, 1988
52.335
-3.409
-6.12%
jan 1, 1989
52.888
+0.552
1.05%
jan 1, 1990
51.646
-1.241
-2.35%
jan 1, 1991
47.3
-4.346
-8.42%
jan 1, 1992
41.407
-5.893
-12.46%
jan 1, 1993
38.68
-2.727
-6.59%
jan 1, 1994
40.143
+1.463
3.78%
jan 1, 1995
38.663
-1.48
-3.69%
jan 1, 1996
31.265
-7.398
-19.13%
jan 1, 1997
30.602
-0.663
-2.12%
jan 1, 1998
27.436
-3.167
-10.35%
jan 1, 1999
20.927
-6.509
-23.72%
jan 1, 2000
20.805
-0.122
-0.58%
jan 1, 2001
15.509
-5.297
-25.46%
jan 1, 2002
16.11
+0.602
3.88%
jan 1, 2003
12.927
-3.183
-19.76%
jan 1, 2004
11.077
-1.85
-14.31%
jan 1, 2005
11.042
-0.035
-0.32%
jan 1, 2006
10.54
-0.502
-4.54%
jan 1, 2007
11.337
+0.797
7.57%
jan 1, 2008
11.132
-0.206
-1.81%
jan 1, 2009
10.734
-0.397
-3.57%
jan 1, 2010
9.732
-1.003
-9.34%
jan 1, 2011
10.141
+0.409
4.2%
jan 1, 2012
9.324
-0.816
-8.05%
jan 1, 2013
9.117
-0.207
-2.22%
jan 1, 2014
8.598
-0.52
-5.7%
Ranking of countries by current statistics by years


Comments: