29
/
en
AIzaSyAYiBZKx7MnpbEhh9jyipgxe19OcubqV5w
April 1, 2024
214116
Norway
NOR
true
2
1
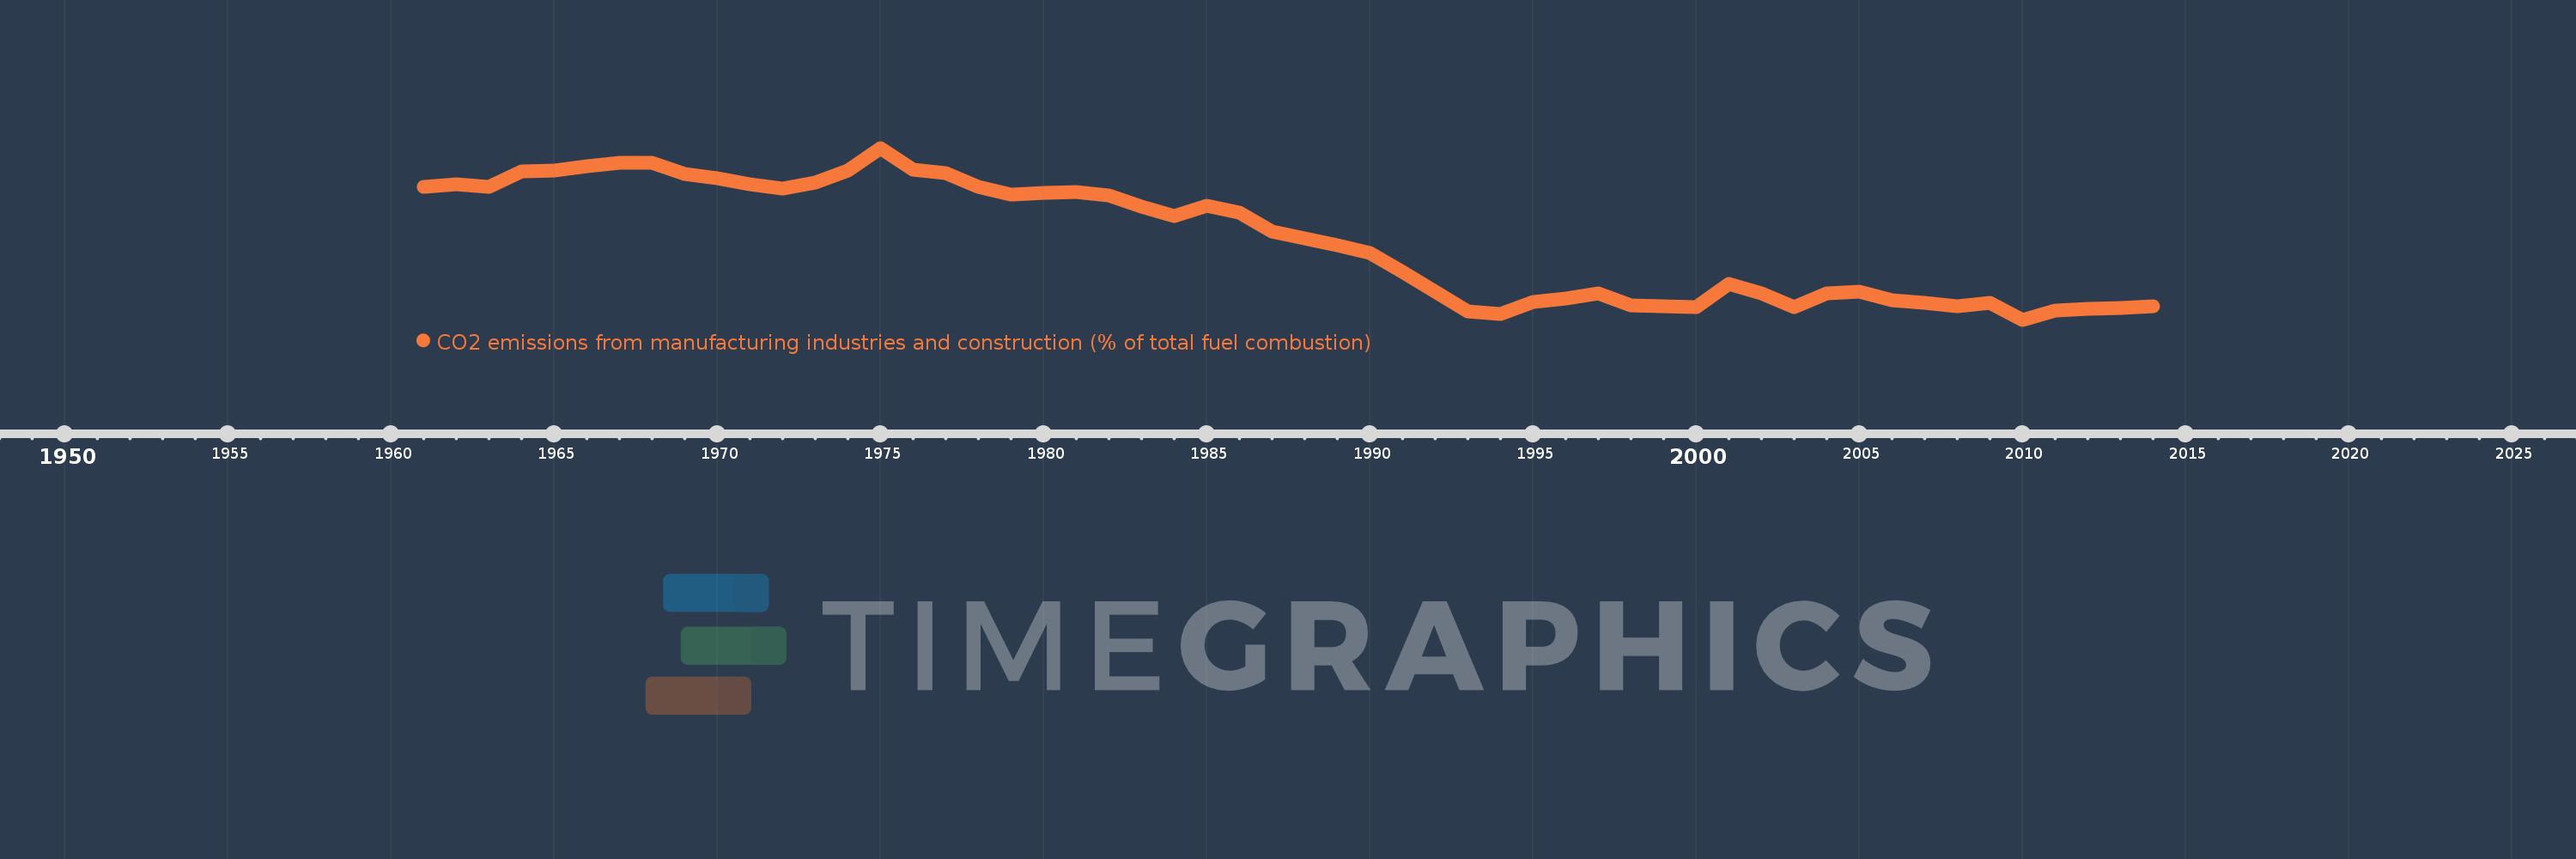
CO2 emissions from manufacturing industries and construction (% of total fuel combustion)
2014,2013,2012,2011,2010,2009,2008,2007,2006,2005,2004,2003,2002,2001,2000,1999,1998,1997,1996,1995,1994,1993,1992,1991,1990,1989,1988,1987,1986,1985,1984,1983,1982,1981,1980,1979,1978,1977,1976,1975,1974,1973,1972,1971,1970,1969,1968,1967,1966,1965,1964,1963,1962,1961
This statistics in other country:
AlbaniaAlgeriaAngolaArab WorldArgentinaArmeniaAustraliaAustriaAzerbaijanBahrainBangladeshBelarusBelgiumBeninBoliviaBosnia and HerzegovinaBotswanaBrazilBrunei DarussalamBulgariaCambodiaCameroonCanadaCaribbean small statesCentral Europe and the BalticsChileChinaColombiaCongo, Dem. Rep.Congo, Rep.Costa RicaCote d'IvoireCroatiaCubaCuracaoCyprusCzech RepublicDenmarkDominican RepublicEarly-demographic dividendEast Asia & PacificEast Asia & Pacific (excluding high income)East Asia & Pacific (IDA & IBRD countries)EcuadorEgypt, Arab Rep.El SalvadorEritreaEstoniaEthiopiaEuro areaEurope & Central AsiaEurope & Central Asia (excluding high income)Europe & Central Asia (IDA & IBRD countries)European UnionFinlandFragile and conflict affected situationsFranceGabonGeorgiaGermanyGhanaGibraltarGreeceGuatemalaHaitiHeavily indebted poor countries (HIPC)High incomeHondurasHong Kong SAR, ChinaHungaryIBRD onlyIcelandIDA & IBRD totalIDA blendIDA onlyIDA totalIndiaIndonesiaIran, Islamic Rep.IraqIrelandIsraelItalyJamaicaJapanJordanKazakhstanKenyaKorea, Dem. People’s Rep.Korea, Rep.KosovoKuwaitKyrgyz RepublicLate-demographic dividendLatin America & Caribbean Latin America & Caribbean (excluding high income)Latin America & the Caribbean (IDA & IBRD countries)LatviaLeast developed countries: UN classificationLebanonLibyaLithuaniaLow & middle incomeLow incomeLower middle incomeLuxembourgMacedonia, FYRMalaysiaMaltaMauritiusMexicoMiddle East & North AfricaMiddle East & North Africa (excluding high income)Middle East & North Africa (IDA & IBRD countries)Middle incomeMoldovaMongoliaMontenegroMoroccoMozambiqueMyanmarNamibiaNepalNetherlandsNew ZealandNicaraguaNigerNigeriaNorth AmericaNorwayOECD membersOmanOther small statesPakistanPanamaParaguayPeruPhilippinesPolandPortugalPost-demographic dividendPre-demographic dividendQatarRomaniaRussian FederationSaudi ArabiaSenegalSerbiaSingaporeSlovak RepublicSloveniaSmall statesSouth AfricaSouth AsiaSouth Asia (IDA & IBRD)South SudanSpainSri LankaSub-Saharan Africa Sub-Saharan Africa (excluding high income)Sub-Saharan Africa (IDA & IBRD countries)SudanSwedenSwitzerlandSyrian Arab RepublicTajikistanTanzaniaThailandTogoTrinidad and TobagoTunisiaTurkeyTurkmenistanUkraineUnited Arab EmiratesUnited KingdomUnited StatesUpper middle incomeUruguayUzbekistanVenezuela, RBVietnamWorldYemen, Rep.ZambiaZimbabwe Timeline:
This timeline shows a graph from 1961 to 2014 of Norway. No data until 1960. Number of actual observations by date: 54.
Source name:
World Development Indicators
Source organization:
IEA Statistics © OECD/IEA 2014 (http://www.iea.org/stats/index.asp), subject to https://www.iea.org/t&c/termsandconditions/
Categories, topics:
Environment
Last updated:
apr 23, 2017
Indicators value changes by year
Minimum:
14.234
jan 1, 2010
Maximum:
44.689
jan 1, 1975
At the date of observation
Value
Absolute change
Change from previous value
jan 1, 1961
37.817
+37.817
0.0%
jan 1, 1962
38.268
+0.451
1.19%
jan 1, 1963
37.75
-0.517
-1.35%
jan 1, 1964
40.588
+2.837
7.52%
jan 1, 1965
40.743
+0.155
0.38%
jan 1, 1966
41.459
+0.716
1.76%
jan 1, 1967
42.035
+0.577
1.39%
jan 1, 1968
42.042
+0.007
0.02%
jan 1, 1969
40.082
-1.96
-4.66%
jan 1, 1970
39.246
-0.836
-2.08%
jan 1, 1971
38.304
-0.942
-2.4%
jan 1, 1972
37.495
-0.81
-2.11%
jan 1, 1973
38.556
+1.062
2.83%
jan 1, 1974
40.753
+2.197
5.7%
jan 1, 1975
44.689
+3.936
9.66%
jan 1, 1976
40.805
-3.884
-8.69%
jan 1, 1977
40.253
-0.553
-1.35%
jan 1, 1978
37.81
-2.442
-6.07%
jan 1, 1979
36.374
-1.437
-3.8%
jan 1, 1980
36.714
+0.34
0.94%
jan 1, 1981
36.834
+0.12
0.33%
jan 1, 1982
36.292
-0.542
-1.47%
jan 1, 1983
34.334
-1.958
-5.4%
jan 1, 1984
32.623
-1.711
-4.98%
jan 1, 1985
34.411
+1.788
5.48%
jan 1, 1986
33.207
-1.204
-3.5%
jan 1, 1987
29.822
-3.386
-10.2%
jan 1, 1988
28.691
-1.131
-3.79%
jan 1, 1989
27.371
-1.32
-4.6%
jan 1, 1990
26.061
-1.31
-4.79%
jan 1, 1991
22.724
-3.337
-12.81%
jan 1, 1992
19.152
-3.572
-15.72%
jan 1, 1993
15.771
-3.381
-17.65%
jan 1, 1994
15.269
-0.503
-3.19%
jan 1, 1995
17.378
+2.109
13.81%
jan 1, 1996
17.95
+0.573
3.29%
jan 1, 1997
18.901
+0.95
5.29%
jan 1, 1998
16.852
-2.049
-10.84%
jan 1, 1999
16.695
-0.157
-0.93%
jan 1, 2000
16.421
-0.274
-1.64%
jan 1, 2001
20.57
+4.149
25.27%
jan 1, 2002
18.841
-1.729
-8.4%
jan 1, 2003
16.523
-2.318
-12.3%
jan 1, 2004
18.866
+2.342
14.18%
jan 1, 2005
19.282
+0.416
2.2%
jan 1, 2006
17.742
-1.539
-7.98%
jan 1, 2007
17.169
-0.574
-3.23%
jan 1, 2008
16.588
-0.58
-3.38%
jan 1, 2009
17.275
+0.686
4.14%
jan 1, 2010
14.234
-3.041
-17.6%
jan 1, 2011
15.854
+1.62
11.38%
jan 1, 2012
16.097
+0.243
1.54%
jan 1, 2013
16.292
+0.194
1.21%
jan 1, 2014
16.605
+0.314
1.93%
Ranking of countries by current statistics by years


Comments: