29
/
en
AIzaSyAYiBZKx7MnpbEhh9jyipgxe19OcubqV5w
April 1, 2024
203928
Myanmar
MMR
true
2
1
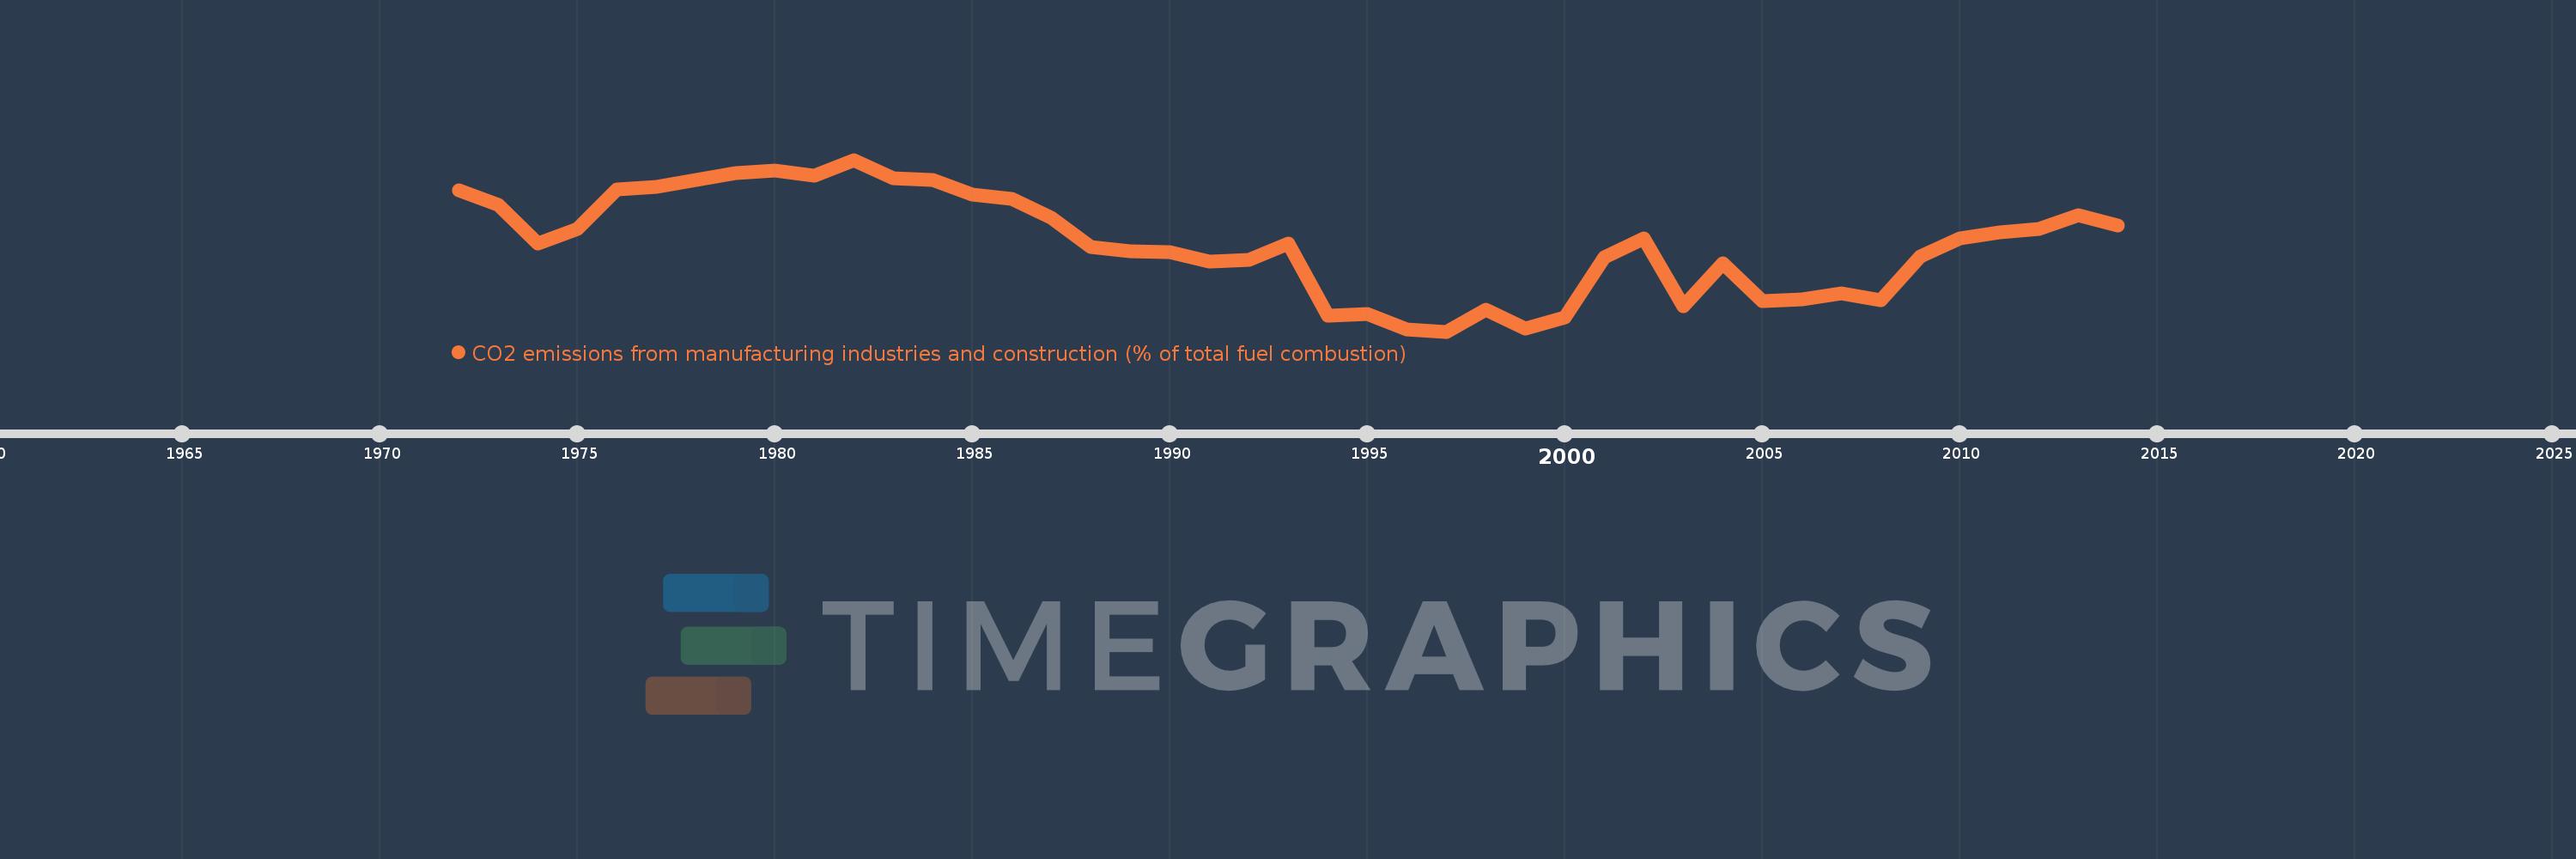
CO2 emissions from manufacturing industries and construction (% of total fuel combustion)
2014,2013,2012,2011,2010,2009,2008,2007,2006,2005,2004,2003,2002,2001,2000,1999,1998,1997,1996,1995,1994,1993,1992,1991,1990,1989,1988,1987,1986,1985,1984,1983,1982,1981,1980,1979,1978,1977,1976,1975,1974,1973,1972
This statistics in other country:
AlbaniaAlgeriaAngolaArab WorldArgentinaArmeniaAustraliaAustriaAzerbaijanBahrainBangladeshBelarusBelgiumBeninBoliviaBosnia and HerzegovinaBotswanaBrazilBrunei DarussalamBulgariaCambodiaCameroonCanadaCaribbean small statesCentral Europe and the BalticsChileChinaColombiaCongo, Dem. Rep.Congo, Rep.Costa RicaCote d'IvoireCroatiaCubaCuracaoCyprusCzech RepublicDenmarkDominican RepublicEarly-demographic dividendEast Asia & PacificEast Asia & Pacific (excluding high income)East Asia & Pacific (IDA & IBRD countries)EcuadorEgypt, Arab Rep.El SalvadorEritreaEstoniaEthiopiaEuro areaEurope & Central AsiaEurope & Central Asia (excluding high income)Europe & Central Asia (IDA & IBRD countries)European UnionFinlandFragile and conflict affected situationsFranceGabonGeorgiaGermanyGhanaGibraltarGreeceGuatemalaHaitiHeavily indebted poor countries (HIPC)High incomeHondurasHong Kong SAR, ChinaHungaryIBRD onlyIcelandIDA & IBRD totalIDA blendIDA onlyIDA totalIndiaIndonesiaIran, Islamic Rep.IraqIrelandIsraelItalyJamaicaJapanJordanKazakhstanKenyaKorea, Dem. People’s Rep.Korea, Rep.KosovoKuwaitKyrgyz RepublicLate-demographic dividendLatin America & Caribbean Latin America & Caribbean (excluding high income)Latin America & the Caribbean (IDA & IBRD countries)LatviaLeast developed countries: UN classificationLebanonLibyaLithuaniaLow & middle incomeLow incomeLower middle incomeLuxembourgMacedonia, FYRMalaysiaMaltaMauritiusMexicoMiddle East & North AfricaMiddle East & North Africa (excluding high income)Middle East & North Africa (IDA & IBRD countries)Middle incomeMoldovaMongoliaMontenegroMoroccoMozambiqueMyanmarNamibiaNepalNetherlandsNew ZealandNicaraguaNigerNigeriaNorth AmericaNorwayOECD membersOmanOther small statesPakistanPanamaParaguayPeruPhilippinesPolandPortugalPost-demographic dividendPre-demographic dividendQatarRomaniaRussian FederationSaudi ArabiaSenegalSerbiaSingaporeSlovak RepublicSloveniaSmall statesSouth AfricaSouth AsiaSouth Asia (IDA & IBRD)South SudanSpainSri LankaSub-Saharan Africa Sub-Saharan Africa (excluding high income)Sub-Saharan Africa (IDA & IBRD countries)SudanSwedenSwitzerlandSyrian Arab RepublicTajikistanTanzaniaThailandTogoTrinidad and TobagoTunisiaTurkeyTurkmenistanUkraineUnited Arab EmiratesUnited KingdomUnited StatesUpper middle incomeUruguayUzbekistanVenezuela, RBVietnamWorldYemen, Rep.ZambiaZimbabwe Timeline:
This timeline shows a graph from 1972 to 2014 of Myanmar. No data until 1971. Number of actual observations by date: 43.
Source name:
World Development Indicators
Source organization:
IEA Statistics © OECD/IEA 2014 (http://www.iea.org/stats/index.asp), subject to https://www.iea.org/t&c/termsandconditions/
Categories, topics:
Environment
Last updated:
apr 23, 2017
Indicators value changes by year
Minimum:
13.803
jan 1, 1997
Maximum:
40.719
jan 1, 1982
At the date of observation
Value
Absolute change
Change from previous value
jan 1, 1972
35.92
+35.92
0.0%
jan 1, 1973
33.713
-2.207
-6.14%
jan 1, 1974
27.616
-6.097
-18.08%
jan 1, 1975
29.851
+2.234
8.09%
jan 1, 1976
36.132
+6.282
21.04%
jan 1, 1977
36.516
+0.383
1.06%
jan 1, 1978
37.5
+0.984
2.7%
jan 1, 1979
38.578
+1.078
2.87%
jan 1, 1980
39.076
+0.498
1.29%
jan 1, 1981
38.264
-0.811
-2.08%
jan 1, 1982
40.719
+2.454
6.41%
jan 1, 1983
37.864
-2.854
-7.01%
jan 1, 1984
37.55
-0.314
-0.83%
jan 1, 1985
35.219
-2.331
-6.21%
jan 1, 1986
34.555
-0.664
-1.89%
jan 1, 1987
31.683
-2.872
-8.31%
jan 1, 1988
27.051
-4.632
-14.62%
jan 1, 1989
26.402
-0.649
-2.4%
jan 1, 1990
26.316
-0.086
-0.33%
jan 1, 1991
24.808
-1.508
-5.73%
jan 1, 1992
25.065
+0.257
1.04%
jan 1, 1993
27.628
+2.563
10.23%
jan 1, 1994
16.344
-11.284
-40.84%
jan 1, 1995
16.514
+0.17
1.04%
jan 1, 1996
14.137
-2.377
-14.39%
jan 1, 1997
13.803
-0.334
-2.36%
jan 1, 1998
17.188
+3.385
24.52%
jan 1, 1999
14.304
-2.883
-16.78%
jan 1, 2000
16.065
+1.761
12.31%
jan 1, 2001
25.431
+9.366
58.3%
jan 1, 2002
28.415
+2.984
11.73%
jan 1, 2003
17.734
-10.681
-37.59%
jan 1, 2004
24.561
+6.827
38.5%
jan 1, 2005
18.619
-5.943
-24.2%
jan 1, 2006
18.904
+0.285
1.53%
jan 1, 2007
19.836
+0.933
4.93%
jan 1, 2008
18.652
-1.184
-5.97%
jan 1, 2009
25.624
+6.972
37.38%
jan 1, 2010
28.43
+2.806
10.95%
jan 1, 2011
29.367
+0.937
3.3%
jan 1, 2012
29.877
+0.509
1.73%
jan 1, 2013
32.031
+2.155
7.21%
jan 1, 2014
30.36
-1.671
-5.22%
Ranking of countries by current statistics by years


Comments: