29
/
en
AIzaSyAYiBZKx7MnpbEhh9jyipgxe19OcubqV5w
April 1, 2024
241391
Slovak Republic
SVK
true
2
1
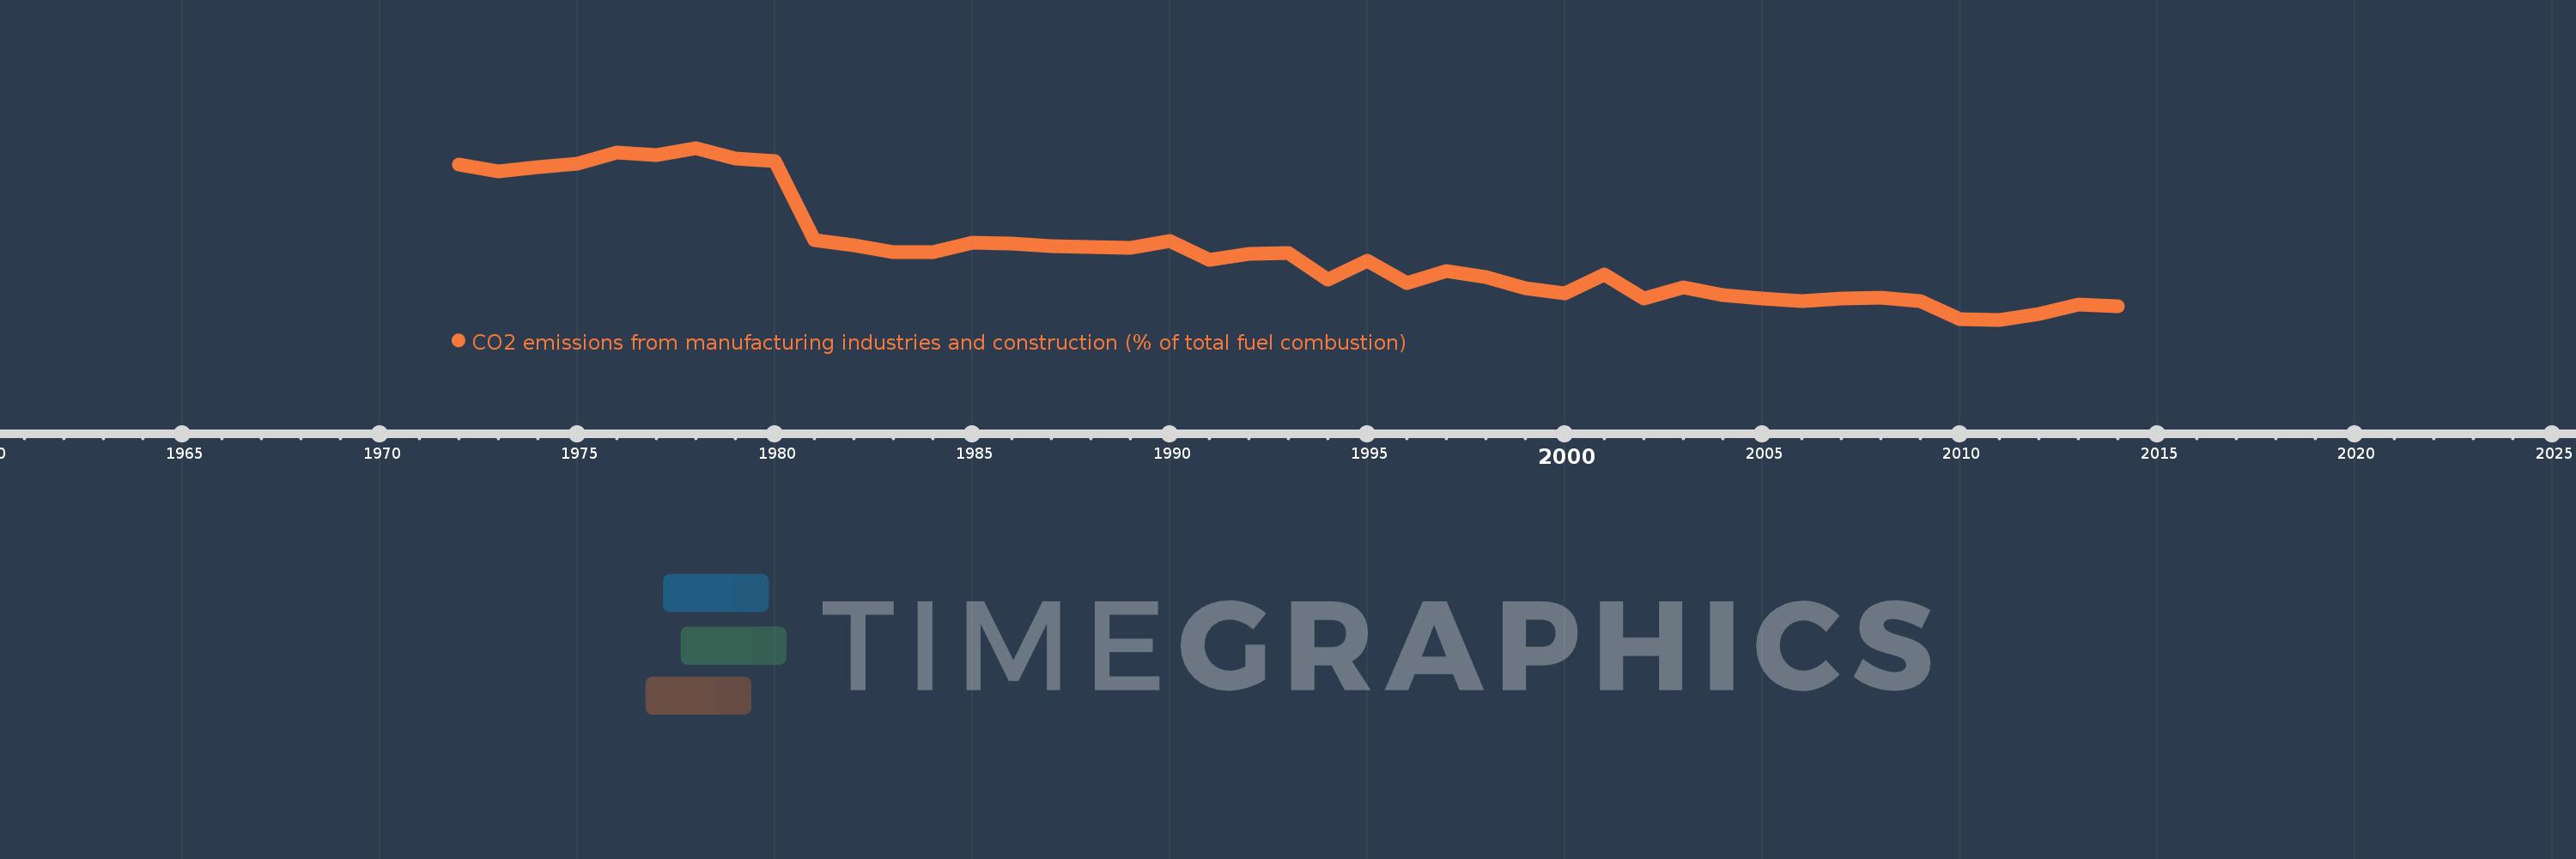
CO2 emissions from manufacturing industries and construction (% of total fuel combustion)
2014,2013,2012,2011,2010,2009,2008,2007,2006,2005,2004,2003,2002,2001,2000,1999,1998,1997,1996,1995,1994,1993,1992,1991,1990,1989,1988,1987,1986,1985,1984,1983,1982,1981,1980,1979,1978,1977,1976,1975,1974,1973,1972
This statistics in other country:
AlbaniaAlgeriaAngolaArab WorldArgentinaArmeniaAustraliaAustriaAzerbaijanBahrainBangladeshBelarusBelgiumBeninBoliviaBosnia and HerzegovinaBotswanaBrazilBrunei DarussalamBulgariaCambodiaCameroonCanadaCaribbean small statesCentral Europe and the BalticsChileChinaColombiaCongo, Dem. Rep.Congo, Rep.Costa RicaCote d'IvoireCroatiaCubaCuracaoCyprusCzech RepublicDenmarkDominican RepublicEarly-demographic dividendEast Asia & PacificEast Asia & Pacific (excluding high income)East Asia & Pacific (IDA & IBRD countries)EcuadorEgypt, Arab Rep.El SalvadorEritreaEstoniaEthiopiaEuro areaEurope & Central AsiaEurope & Central Asia (excluding high income)Europe & Central Asia (IDA & IBRD countries)European UnionFinlandFragile and conflict affected situationsFranceGabonGeorgiaGermanyGhanaGibraltarGreeceGuatemalaHaitiHeavily indebted poor countries (HIPC)High incomeHondurasHong Kong SAR, ChinaHungaryIBRD onlyIcelandIDA & IBRD totalIDA blendIDA onlyIDA totalIndiaIndonesiaIran, Islamic Rep.IraqIrelandIsraelItalyJamaicaJapanJordanKazakhstanKenyaKorea, Dem. People’s Rep.Korea, Rep.KosovoKuwaitKyrgyz RepublicLate-demographic dividendLatin America & Caribbean Latin America & Caribbean (excluding high income)Latin America & the Caribbean (IDA & IBRD countries)LatviaLeast developed countries: UN classificationLebanonLibyaLithuaniaLow & middle incomeLow incomeLower middle incomeLuxembourgMacedonia, FYRMalaysiaMaltaMauritiusMexicoMiddle East & North AfricaMiddle East & North Africa (excluding high income)Middle East & North Africa (IDA & IBRD countries)Middle incomeMoldovaMongoliaMontenegroMoroccoMozambiqueMyanmarNamibiaNepalNetherlandsNew ZealandNicaraguaNigerNigeriaNorth AmericaNorwayOECD membersOmanOther small statesPakistanPanamaParaguayPeruPhilippinesPolandPortugalPost-demographic dividendPre-demographic dividendQatarRomaniaRussian FederationSaudi ArabiaSenegalSerbiaSingaporeSlovak RepublicSloveniaSmall statesSouth AfricaSouth AsiaSouth Asia (IDA & IBRD)South SudanSpainSri LankaSub-Saharan Africa Sub-Saharan Africa (excluding high income)Sub-Saharan Africa (IDA & IBRD countries)SudanSwedenSwitzerlandSyrian Arab RepublicTajikistanTanzaniaThailandTogoTrinidad and TobagoTunisiaTurkeyTurkmenistanUkraineUnited Arab EmiratesUnited KingdomUnited StatesUpper middle incomeUruguayUzbekistanVenezuela, RBVietnamWorldYemen, Rep.ZambiaZimbabwe Timeline:
This timeline shows a graph from 1972 to 2014 of Slovak Republic. No data until 1971. Number of actual observations by date: 43.
Source name:
World Development Indicators
Source organization:
IEA Statistics © OECD/IEA 2014 (http://www.iea.org/stats/index.asp), subject to https://www.iea.org/t&c/termsandconditions/
Categories, topics:
Environment
Last updated:
apr 23, 2017
Indicators value changes by year
Minimum:
19.589
jan 1, 2011
Maximum:
46.213
jan 1, 1978
At the date of observation
Value
Absolute change
Change from previous value
jan 1, 1972
43.633
+43.633
0.0%
jan 1, 1973
42.545
-1.088
-2.49%
jan 1, 1974
43.192
+0.647
1.52%
jan 1, 1975
43.775
+0.584
1.35%
jan 1, 1976
45.505
+1.73
3.95%
jan 1, 1977
45.172
-0.333
-0.73%
jan 1, 1978
46.213
+1.041
2.31%
jan 1, 1979
44.631
-1.582
-3.42%
jan 1, 1980
44.201
-0.43
-0.96%
jan 1, 1981
31.971
-12.23
-27.67%
jan 1, 1982
31.148
-0.823
-2.58%
jan 1, 1983
30.072
-1.076
-3.45%
jan 1, 1984
30.097
+0.025
0.08%
jan 1, 1985
31.471
+1.374
4.57%
jan 1, 1986
31.392
-0.079
-0.25%
jan 1, 1987
31.0
-0.393
-1.25%
jan 1, 1988
30.886
-0.114
-0.37%
jan 1, 1989
30.781
-0.105
-0.34%
jan 1, 1990
31.768
+0.988
3.21%
jan 1, 1991
28.853
-2.915
-9.18%
jan 1, 1992
29.823
+0.97
3.36%
jan 1, 1993
29.978
+0.155
0.52%
jan 1, 1994
25.774
-4.204
-14.02%
jan 1, 1995
28.677
+2.903
11.26%
jan 1, 1996
25.328
-3.35
-11.68%
jan 1, 1997
27.191
+1.863
7.36%
jan 1, 1998
26.254
-0.937
-3.44%
jan 1, 1999
24.533
-1.722
-6.56%
jan 1, 2000
23.616
-0.917
-3.74%
jan 1, 2001
26.627
+3.011
12.75%
jan 1, 2002
22.832
-3.795
-14.25%
jan 1, 2003
24.668
+1.836
8.04%
jan 1, 2004
23.476
-1.192
-4.83%
jan 1, 2005
22.839
-0.637
-2.71%
jan 1, 2006
22.497
-0.342
-1.5%
jan 1, 2007
22.923
+0.426
1.89%
jan 1, 2008
23.06
+0.137
0.6%
jan 1, 2009
22.501
-0.558
-2.42%
jan 1, 2010
19.632
-2.87
-12.75%
jan 1, 2011
19.589
-0.043
-0.22%
jan 1, 2012
20.426
+0.837
4.27%
jan 1, 2013
21.991
+1.565
7.66%
jan 1, 2014
21.68
-0.311
-1.41%
Ranking of countries by current statistics by years


Comments: