29
/
en
AIzaSyAYiBZKx7MnpbEhh9jyipgxe19OcubqV5w
April 1, 2024
35597
High income
HIC
false
2
1
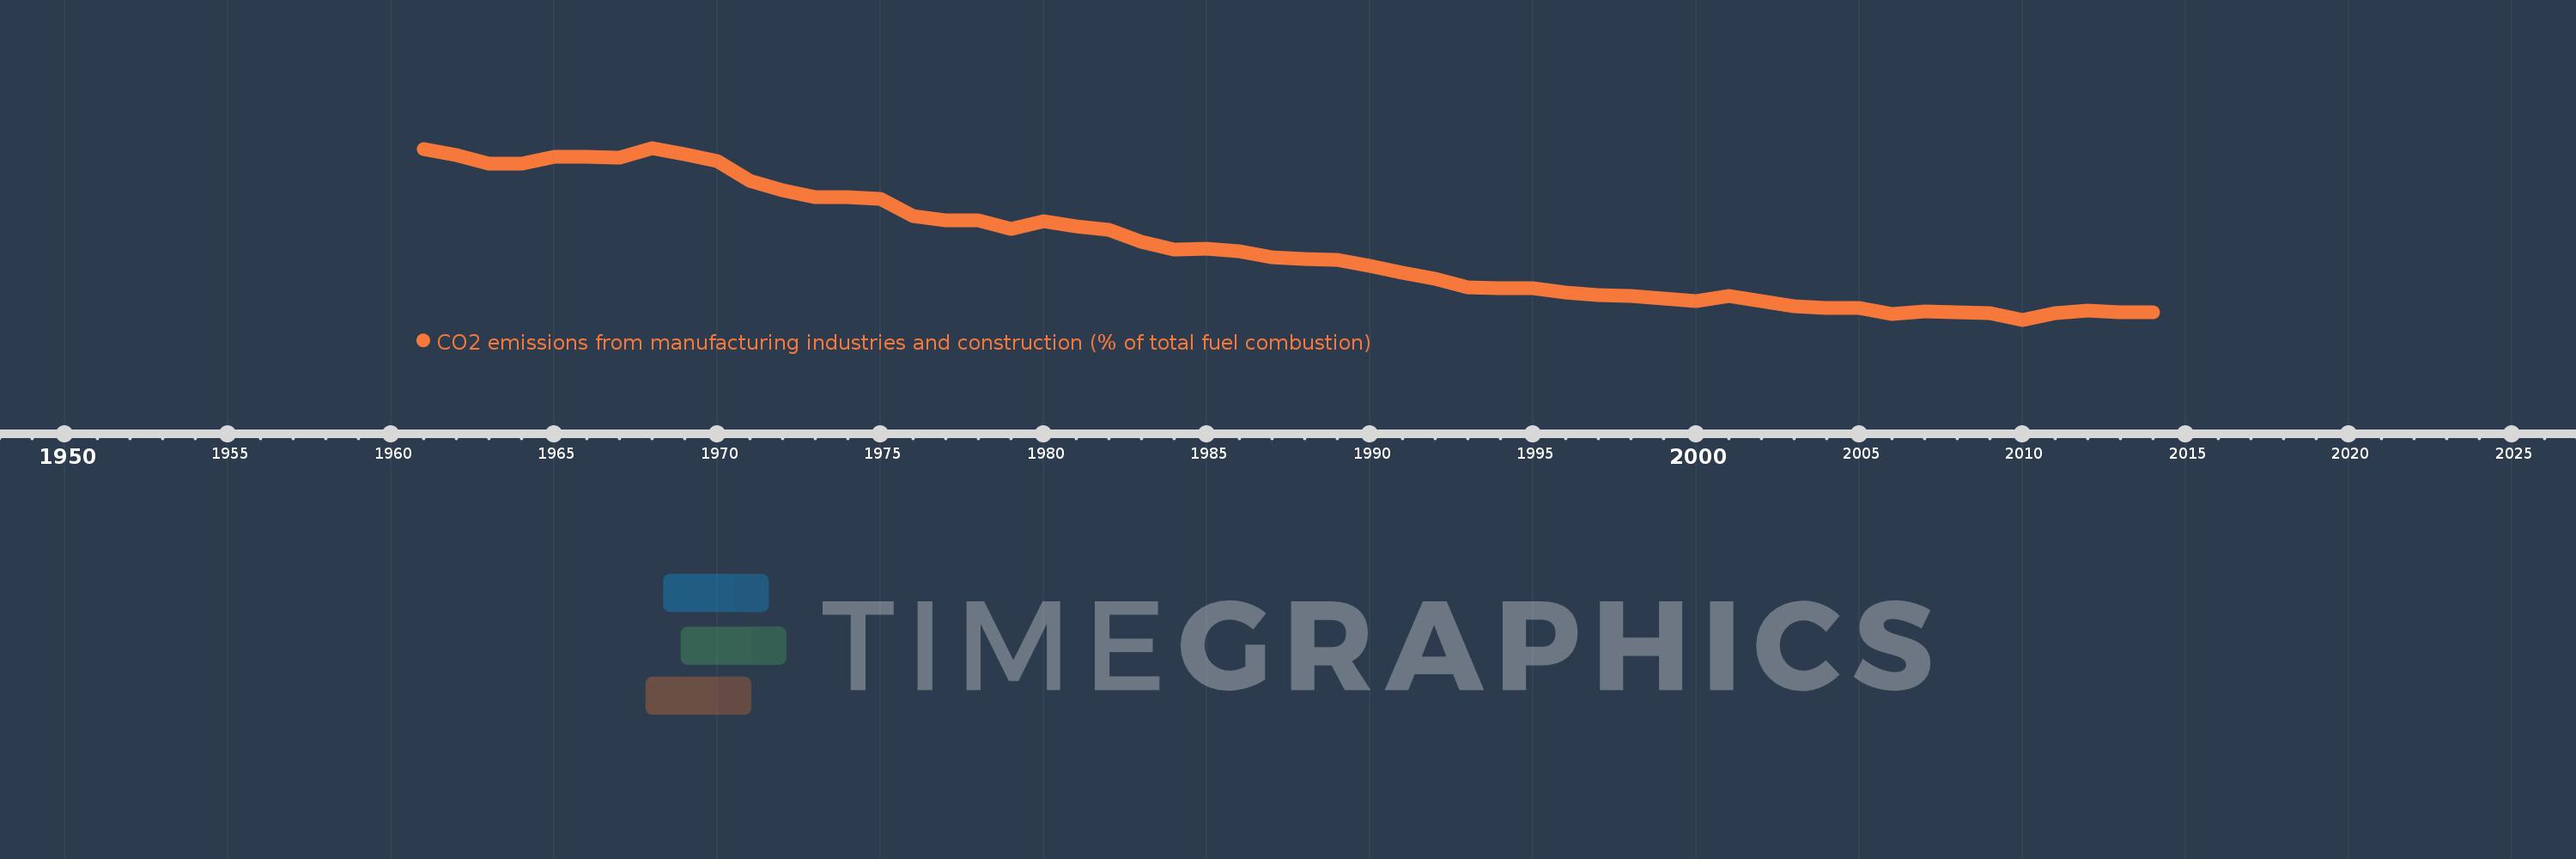
CO2 emissions from manufacturing industries and construction (% of total fuel combustion)
2014,2013,2012,2011,2010,2009,2008,2007,2006,2005,2004,2003,2002,2001,2000,1999,1998,1997,1996,1995,1994,1993,1992,1991,1990,1989,1988,1987,1986,1985,1984,1983,1982,1981,1980,1979,1978,1977,1976,1975,1974,1973,1972,1971,1970,1969,1968,1967,1966,1965,1964,1963,1962,1961
This statistics in other country:
AlbaniaAlgeriaAngolaArab WorldArgentinaArmeniaAustraliaAustriaAzerbaijanBahrainBangladeshBelarusBelgiumBeninBoliviaBosnia and HerzegovinaBotswanaBrazilBrunei DarussalamBulgariaCambodiaCameroonCanadaCaribbean small statesCentral Europe and the BalticsChileChinaColombiaCongo, Dem. Rep.Congo, Rep.Costa RicaCote d'IvoireCroatiaCubaCuracaoCyprusCzech RepublicDenmarkDominican RepublicEarly-demographic dividendEast Asia & PacificEast Asia & Pacific (excluding high income)East Asia & Pacific (IDA & IBRD countries)EcuadorEgypt, Arab Rep.El SalvadorEritreaEstoniaEthiopiaEuro areaEurope & Central AsiaEurope & Central Asia (excluding high income)Europe & Central Asia (IDA & IBRD countries)European UnionFinlandFragile and conflict affected situationsFranceGabonGeorgiaGermanyGhanaGibraltarGreeceGuatemalaHaitiHeavily indebted poor countries (HIPC)High incomeHondurasHong Kong SAR, ChinaHungaryIBRD onlyIcelandIDA & IBRD totalIDA blendIDA onlyIDA totalIndiaIndonesiaIran, Islamic Rep.IraqIrelandIsraelItalyJamaicaJapanJordanKazakhstanKenyaKorea, Dem. People’s Rep.Korea, Rep.KosovoKuwaitKyrgyz RepublicLate-demographic dividendLatin America & Caribbean Latin America & Caribbean (excluding high income)Latin America & the Caribbean (IDA & IBRD countries)LatviaLeast developed countries: UN classificationLebanonLibyaLithuaniaLow & middle incomeLow incomeLower middle incomeLuxembourgMacedonia, FYRMalaysiaMaltaMauritiusMexicoMiddle East & North AfricaMiddle East & North Africa (excluding high income)Middle East & North Africa (IDA & IBRD countries)Middle incomeMoldovaMongoliaMontenegroMoroccoMozambiqueMyanmarNamibiaNepalNetherlandsNew ZealandNicaraguaNigerNigeriaNorth AmericaNorwayOECD membersOmanOther small statesPakistanPanamaParaguayPeruPhilippinesPolandPortugalPost-demographic dividendPre-demographic dividendQatarRomaniaRussian FederationSaudi ArabiaSenegalSerbiaSingaporeSlovak RepublicSloveniaSmall statesSouth AfricaSouth AsiaSouth Asia (IDA & IBRD)South SudanSpainSri LankaSub-Saharan Africa Sub-Saharan Africa (excluding high income)Sub-Saharan Africa (IDA & IBRD countries)SudanSwedenSwitzerlandSyrian Arab RepublicTajikistanTanzaniaThailandTogoTrinidad and TobagoTunisiaTurkeyTurkmenistanUkraineUnited Arab EmiratesUnited KingdomUnited StatesUpper middle incomeUruguayUzbekistanVenezuela, RBVietnamWorldYemen, Rep.ZambiaZimbabwe Timeline:
This timeline shows a graph from 1961 to 2014 of High income. No data until 1960. Number of actual observations by date: 54.
Source name:
World Development Indicators
Source organization:
IEA Statistics © OECD/IEA 2014 (http://www.iea.org/stats/index.asp), subject to https://www.iea.org/t&c/termsandconditions/
Categories, topics:
Environment
Last updated:
apr 23, 2017
Indicators value changes by year
Minimum:
11.659
jan 1, 2010
Maximum:
29.449
jan 1, 1968
At the date of observation
Value
Absolute change
Change from previous value
jan 1, 1961
29.332
+29.332
0.0%
jan 1, 1962
28.696
-0.636
-2.17%
jan 1, 1963
27.835
-0.861
-3.0%
jan 1, 1964
27.854
+0.019
0.07%
jan 1, 1965
28.494
+0.64
2.3%
jan 1, 1966
28.536
+0.042
0.15%
jan 1, 1967
28.452
-0.084
-0.29%
jan 1, 1968
29.449
+0.997
3.5%
jan 1, 1969
28.814
-0.635
-2.16%
jan 1, 1970
28.113
-0.702
-2.44%
jan 1, 1971
26.071
-2.042
-7.26%
jan 1, 1972
25.054
-1.017
-3.9%
jan 1, 1973
24.372
-0.681
-2.72%
jan 1, 1974
24.366
-0.006
-0.02%
jan 1, 1975
24.182
-0.184
-0.75%
jan 1, 1976
22.393
-1.79
-7.4%
jan 1, 1977
21.932
-0.461
-2.06%
jan 1, 1978
21.909
-0.023
-0.11%
jan 1, 1979
21.071
-0.837
-3.82%
jan 1, 1980
21.868
+0.796
3.78%
jan 1, 1981
21.371
-0.496
-2.27%
jan 1, 1982
20.967
-0.405
-1.89%
jan 1, 1983
19.764
-1.203
-5.74%
jan 1, 1984
18.95
-0.814
-4.12%
jan 1, 1985
18.976
+0.027
0.14%
jan 1, 1986
18.739
-0.237
-1.25%
jan 1, 1987
18.129
-0.611
-3.26%
jan 1, 1988
17.94
-0.188
-1.04%
jan 1, 1989
17.852
-0.088
-0.49%
jan 1, 1990
17.268
-0.585
-3.27%
jan 1, 1991
16.55
-0.717
-4.15%
jan 1, 1992
15.884
-0.667
-4.03%
jan 1, 1993
15.027
-0.857
-5.39%
jan 1, 1994
14.922
-0.105
-0.7%
jan 1, 1995
14.953
+0.031
0.21%
jan 1, 1996
14.523
-0.431
-2.88%
jan 1, 1997
14.237
-0.286
-1.97%
jan 1, 1998
14.165
-0.071
-0.5%
jan 1, 1999
13.851
-0.314
-2.22%
jan 1, 2000
13.596
-0.255
-1.84%
jan 1, 2001
14.086
+0.49
3.6%
jan 1, 2002
13.611
-0.476
-3.38%
jan 1, 2003
13.072
-0.538
-3.95%
jan 1, 2004
12.893
-0.179
-1.37%
jan 1, 2005
12.88
-0.013
-0.1%
jan 1, 2006
12.283
-0.598
-4.64%
jan 1, 2007
12.518
+0.236
1.92%
jan 1, 2008
12.395
-0.123
-0.98%
jan 1, 2009
12.364
-0.032
-0.25%
jan 1, 2010
11.659
-0.704
-5.7%
jan 1, 2011
12.371
+0.712
6.1%
jan 1, 2012
12.572
+0.201
1.62%
jan 1, 2013
12.429
-0.143
-1.13%
jan 1, 2014
12.456
+0.027
0.22%
Ranking of countries by current statistics by years


Comments: