29
/
en
AIzaSyAYiBZKx7MnpbEhh9jyipgxe19OcubqV5w
April 1, 2024
83832
Benin
BEN
true
2
1
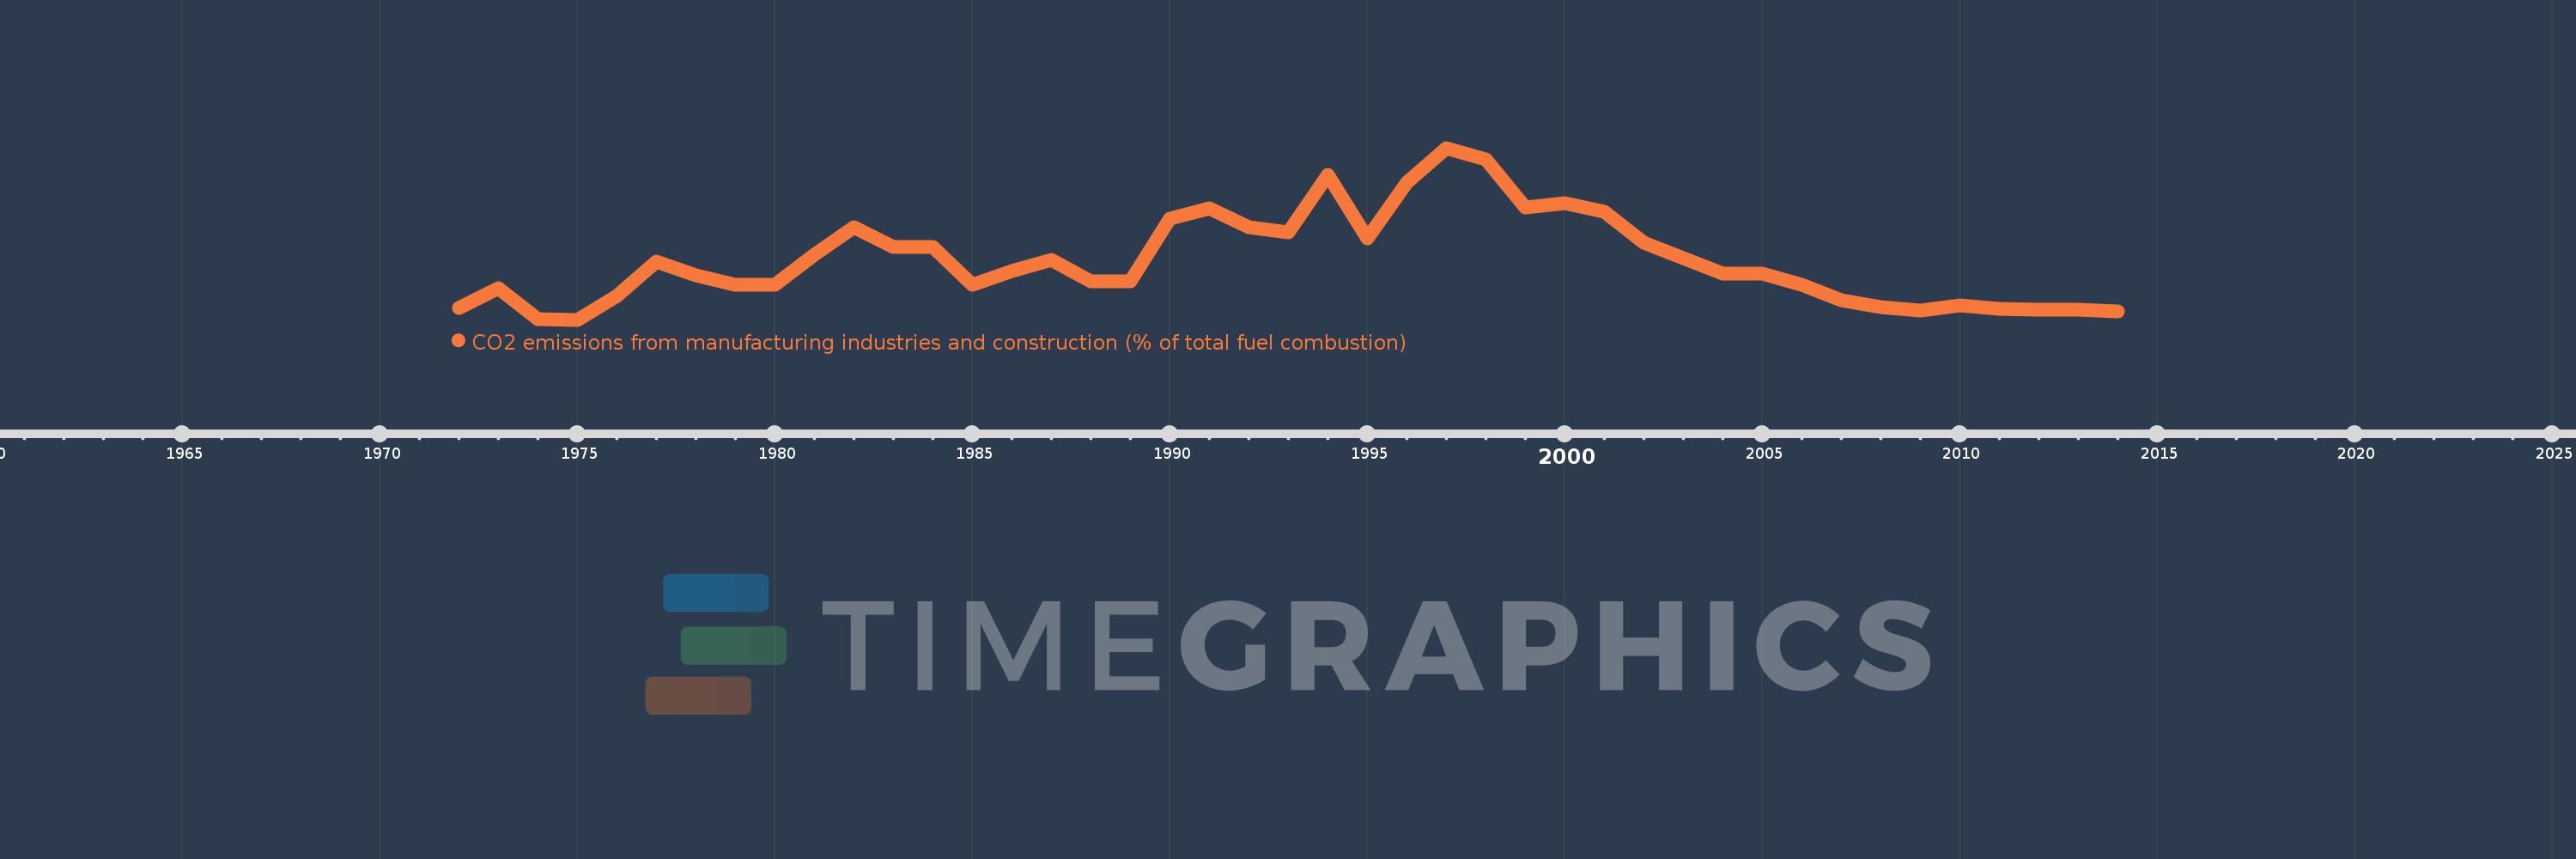
CO2 emissions from manufacturing industries and construction (% of total fuel combustion)
2014,2013,2012,2011,2010,2009,2008,2007,2006,2005,2004,2003,2002,2001,2000,1999,1998,1997,1996,1995,1994,1993,1992,1991,1990,1989,1988,1987,1986,1985,1984,1983,1982,1981,1980,1979,1978,1977,1976,1975,1974,1973,1972
This statistics in other country:
AlbaniaAlgeriaAngolaArab WorldArgentinaArmeniaAustraliaAustriaAzerbaijanBahrainBangladeshBelarusBelgiumBeninBoliviaBosnia and HerzegovinaBotswanaBrazilBrunei DarussalamBulgariaCambodiaCameroonCanadaCaribbean small statesCentral Europe and the BalticsChileChinaColombiaCongo, Dem. Rep.Congo, Rep.Costa RicaCote d'IvoireCroatiaCubaCuracaoCyprusCzech RepublicDenmarkDominican RepublicEarly-demographic dividendEast Asia & PacificEast Asia & Pacific (excluding high income)East Asia & Pacific (IDA & IBRD countries)EcuadorEgypt, Arab Rep.El SalvadorEritreaEstoniaEthiopiaEuro areaEurope & Central AsiaEurope & Central Asia (excluding high income)Europe & Central Asia (IDA & IBRD countries)European UnionFinlandFragile and conflict affected situationsFranceGabonGeorgiaGermanyGhanaGibraltarGreeceGuatemalaHaitiHeavily indebted poor countries (HIPC)High incomeHondurasHong Kong SAR, ChinaHungaryIBRD onlyIcelandIDA & IBRD totalIDA blendIDA onlyIDA totalIndiaIndonesiaIran, Islamic Rep.IraqIrelandIsraelItalyJamaicaJapanJordanKazakhstanKenyaKorea, Dem. People’s Rep.Korea, Rep.KosovoKuwaitKyrgyz RepublicLate-demographic dividendLatin America & Caribbean Latin America & Caribbean (excluding high income)Latin America & the Caribbean (IDA & IBRD countries)LatviaLeast developed countries: UN classificationLebanonLibyaLithuaniaLow & middle incomeLow incomeLower middle incomeLuxembourgMacedonia, FYRMalaysiaMaltaMauritiusMexicoMiddle East & North AfricaMiddle East & North Africa (excluding high income)Middle East & North Africa (IDA & IBRD countries)Middle incomeMoldovaMongoliaMontenegroMoroccoMozambiqueMyanmarNamibiaNepalNetherlandsNew ZealandNicaraguaNigerNigeriaNorth AmericaNorwayOECD membersOmanOther small statesPakistanPanamaParaguayPeruPhilippinesPolandPortugalPost-demographic dividendPre-demographic dividendQatarRomaniaRussian FederationSaudi ArabiaSenegalSerbiaSingaporeSlovak RepublicSloveniaSmall statesSouth AfricaSouth AsiaSouth Asia (IDA & IBRD)South SudanSpainSri LankaSub-Saharan Africa Sub-Saharan Africa (excluding high income)Sub-Saharan Africa (IDA & IBRD countries)SudanSwedenSwitzerlandSyrian Arab RepublicTajikistanTanzaniaThailandTogoTrinidad and TobagoTunisiaTurkeyTurkmenistanUkraineUnited Arab EmiratesUnited KingdomUnited StatesUpper middle incomeUruguayUzbekistanVenezuela, RBVietnamWorldYemen, Rep.ZambiaZimbabwe Timeline:
This timeline shows a graph from 1972 to 2014 of Benin. No data until 1971. Number of actual observations by date: 43.
Source name:
World Development Indicators
Source organization:
IEA Statistics © OECD/IEA 2014 (http://www.iea.org/stats/index.asp), subject to https://www.iea.org/t&c/termsandconditions/
Categories, topics:
Environment
Last updated:
apr 23, 2017
Indicators value changes by year
Maximum:
16.484
jan 1, 1997
At the date of observation
Value
Absolute change
Change from previous value
jan 1, 1972
3.333
+3.333
0.0%
jan 1, 1973
5.0
+1.667
50.0%
jan 1, 1974
2.439
-2.561
-51.22%
jan 1, 1975
2.381
-0.058
-2.38%
jan 1, 1976
4.348
+1.967
82.61%
jan 1, 1977
7.143
+2.795
64.29%
jan 1, 1978
6.061
-1.082
-15.15%
jan 1, 1979
5.263
-0.797
-13.16%
jan 1, 1980
5.263
0.0
0.0%
jan 1, 1981
7.692
+2.429
46.15%
jan 1, 1982
10.0
+2.308
30.0%
jan 1, 1983
8.333
-1.667
-16.67%
jan 1, 1984
8.333
0.0
0.0%
jan 1, 1985
5.263
-3.07
-36.84%
jan 1, 1986
6.383
+1.12
21.28%
jan 1, 1987
7.317
+0.934
14.63%
jan 1, 1988
5.556
-1.762
-24.07%
jan 1, 1989
5.556
0.0
0.0%
jan 1, 1990
10.714
+5.159
92.86%
jan 1, 1991
11.538
+0.824
7.69%
jan 1, 1992
10.0
-1.538
-13.33%
jan 1, 1993
9.524
-0.476
-4.76%
jan 1, 1994
14.286
+4.762
50.0%
jan 1, 1995
9.091
-5.195
-36.36%
jan 1, 1996
13.636
+4.545
50.0%
jan 1, 1997
16.484
+2.847
20.88%
jan 1, 1998
15.517
-0.966
-5.86%
jan 1, 1999
11.57
-3.947
-25.44%
jan 1, 2000
11.94
+0.37
3.2%
jan 1, 2001
11.268
-0.673
-5.63%
jan 1, 2002
8.671
-2.597
-23.05%
jan 1, 2003
7.426
-1.245
-14.36%
jan 1, 2004
6.14
-1.285
-17.31%
jan 1, 2005
6.173
+0.032
0.53%
jan 1, 2006
5.224
-0.949
-15.37%
jan 1, 2007
4.012
-1.212
-23.19%
jan 1, 2008
3.43
-0.582
-14.51%
jan 1, 2009
3.133
-0.297
-8.66%
jan 1, 2010
3.58
+0.447
14.26%
jan 1, 2011
3.297
-0.283
-7.91%
jan 1, 2012
3.198
-0.098
-2.99%
jan 1, 2013
3.239
+0.041
1.27%
jan 1, 2014
3.065
-0.174
-5.36%
Ranking of countries by current statistics by years


Comments: