29
/
en
AIzaSyAYiBZKx7MnpbEhh9jyipgxe19OcubqV5w
April 1, 2024
77976
Bangladesh
BGD
true
2
1
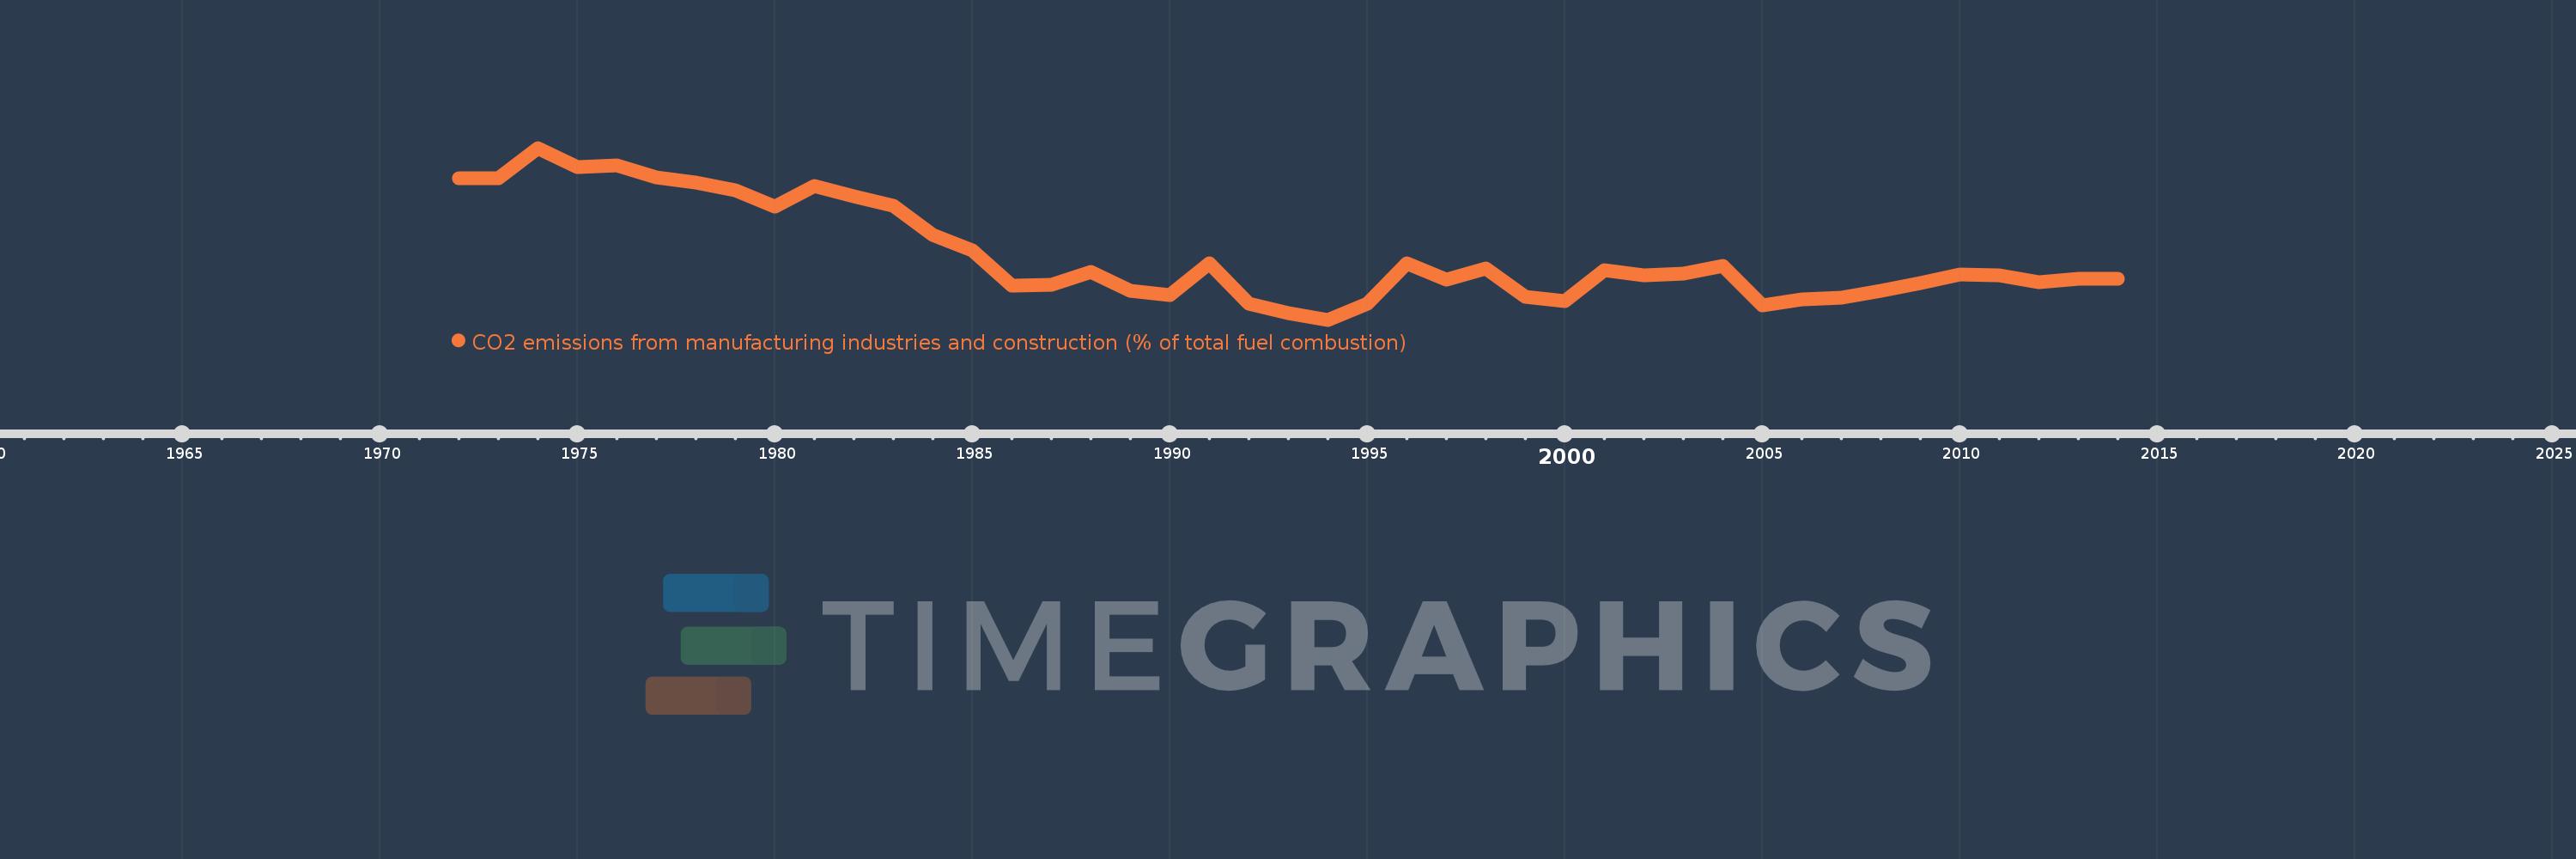
CO2 emissions from manufacturing industries and construction (% of total fuel combustion)
2014,2013,2012,2011,2010,2009,2008,2007,2006,2005,2004,2003,2002,2001,2000,1999,1998,1997,1996,1995,1994,1993,1992,1991,1990,1989,1988,1987,1986,1985,1984,1983,1982,1981,1980,1979,1978,1977,1976,1975,1974,1973,1972
This statistics in other country:
AlbaniaAlgeriaAngolaArab WorldArgentinaArmeniaAustraliaAustriaAzerbaijanBahrainBangladeshBelarusBelgiumBeninBoliviaBosnia and HerzegovinaBotswanaBrazilBrunei DarussalamBulgariaCambodiaCameroonCanadaCaribbean small statesCentral Europe and the BalticsChileChinaColombiaCongo, Dem. Rep.Congo, Rep.Costa RicaCote d'IvoireCroatiaCubaCuracaoCyprusCzech RepublicDenmarkDominican RepublicEarly-demographic dividendEast Asia & PacificEast Asia & Pacific (excluding high income)East Asia & Pacific (IDA & IBRD countries)EcuadorEgypt, Arab Rep.El SalvadorEritreaEstoniaEthiopiaEuro areaEurope & Central AsiaEurope & Central Asia (excluding high income)Europe & Central Asia (IDA & IBRD countries)European UnionFinlandFragile and conflict affected situationsFranceGabonGeorgiaGermanyGhanaGibraltarGreeceGuatemalaHaitiHeavily indebted poor countries (HIPC)High incomeHondurasHong Kong SAR, ChinaHungaryIBRD onlyIcelandIDA & IBRD totalIDA blendIDA onlyIDA totalIndiaIndonesiaIran, Islamic Rep.IraqIrelandIsraelItalyJamaicaJapanJordanKazakhstanKenyaKorea, Dem. People’s Rep.Korea, Rep.KosovoKuwaitKyrgyz RepublicLate-demographic dividendLatin America & Caribbean Latin America & Caribbean (excluding high income)Latin America & the Caribbean (IDA & IBRD countries)LatviaLeast developed countries: UN classificationLebanonLibyaLithuaniaLow & middle incomeLow incomeLower middle incomeLuxembourgMacedonia, FYRMalaysiaMaltaMauritiusMexicoMiddle East & North AfricaMiddle East & North Africa (excluding high income)Middle East & North Africa (IDA & IBRD countries)Middle incomeMoldovaMongoliaMontenegroMoroccoMozambiqueMyanmarNamibiaNepalNetherlandsNew ZealandNicaraguaNigerNigeriaNorth AmericaNorwayOECD membersOmanOther small statesPakistanPanamaParaguayPeruPhilippinesPolandPortugalPost-demographic dividendPre-demographic dividendQatarRomaniaRussian FederationSaudi ArabiaSenegalSerbiaSingaporeSlovak RepublicSloveniaSmall statesSouth AfricaSouth AsiaSouth Asia (IDA & IBRD)South SudanSpainSri LankaSub-Saharan Africa Sub-Saharan Africa (excluding high income)Sub-Saharan Africa (IDA & IBRD countries)SudanSwedenSwitzerlandSyrian Arab RepublicTajikistanTanzaniaThailandTogoTrinidad and TobagoTunisiaTurkeyTurkmenistanUkraineUnited Arab EmiratesUnited KingdomUnited StatesUpper middle incomeUruguayUzbekistanVenezuela, RBVietnamWorldYemen, Rep.ZambiaZimbabwe Timeline:
This timeline shows a graph from 1972 to 2014 of Bangladesh. No data until 1971. Number of actual observations by date: 43.
Source name:
World Development Indicators
Source organization:
IEA Statistics © OECD/IEA 2014 (http://www.iea.org/stats/index.asp), subject to https://www.iea.org/t&c/termsandconditions/
Categories, topics:
Environment
Last updated:
apr 23, 2017
Indicators value changes by year
Minimum:
11.689
jan 1, 1994
Maximum:
37.537
jan 1, 1974
At the date of observation
Value
Absolute change
Change from previous value
jan 1, 1972
32.986
+32.986
0.0%
jan 1, 1973
32.986
0.0
0.0%
jan 1, 1974
37.537
+4.551
13.8%
jan 1, 1975
34.704
-2.832
-7.55%
jan 1, 1976
34.921
+0.216
0.62%
jan 1, 1977
33.12
-1.801
-5.16%
jan 1, 1978
32.292
-0.828
-2.5%
jan 1, 1979
31.214
-1.078
-3.34%
jan 1, 1980
28.772
-2.442
-7.82%
jan 1, 1981
31.763
+2.991
10.4%
jan 1, 1982
30.298
-1.465
-4.61%
jan 1, 1983
28.779
-1.519
-5.01%
jan 1, 1984
24.417
-4.362
-15.16%
jan 1, 1985
22.066
-2.351
-9.63%
jan 1, 1986
16.883
-5.183
-23.49%
jan 1, 1987
16.901
+0.018
0.11%
jan 1, 1988
18.83
+1.928
11.41%
jan 1, 1989
16.086
-2.744
-14.57%
jan 1, 1990
15.348
-0.738
-4.59%
jan 1, 1991
20.228
+4.88
31.79%
jan 1, 1992
14.047
-6.181
-30.56%
jan 1, 1993
12.692
-1.355
-9.65%
jan 1, 1994
11.689
-1.002
-7.9%
jan 1, 1995
14.105
+2.416
20.67%
jan 1, 1996
20.146
+6.04
42.82%
jan 1, 1997
17.756
-2.389
-11.86%
jan 1, 1998
19.37
+1.614
9.09%
jan 1, 1999
15.076
-4.294
-22.17%
jan 1, 2000
14.489
-0.587
-3.9%
jan 1, 2001
19.15
+4.661
32.17%
jan 1, 2002
18.405
-0.745
-3.89%
jan 1, 2003
18.682
+0.277
1.5%
jan 1, 2004
19.762
+1.081
5.78%
jan 1, 2005
13.858
-5.904
-29.88%
jan 1, 2006
14.71
+0.852
6.15%
jan 1, 2007
15.057
+0.346
2.35%
jan 1, 2008
16.081
+1.025
6.81%
jan 1, 2009
17.172
+1.091
6.78%
jan 1, 2010
18.529
+1.356
7.9%
jan 1, 2011
18.391
-0.137
-0.74%
jan 1, 2012
17.377
-1.015
-5.52%
jan 1, 2013
17.903
+0.526
3.03%
jan 1, 2014
17.797
-0.105
-0.59%
Ranking of countries by current statistics by years


Comments: