29
/
en
AIzaSyAYiBZKx7MnpbEhh9jyipgxe19OcubqV5w
April 1, 2024
229512
Russian Federation
RUS
true
2
1
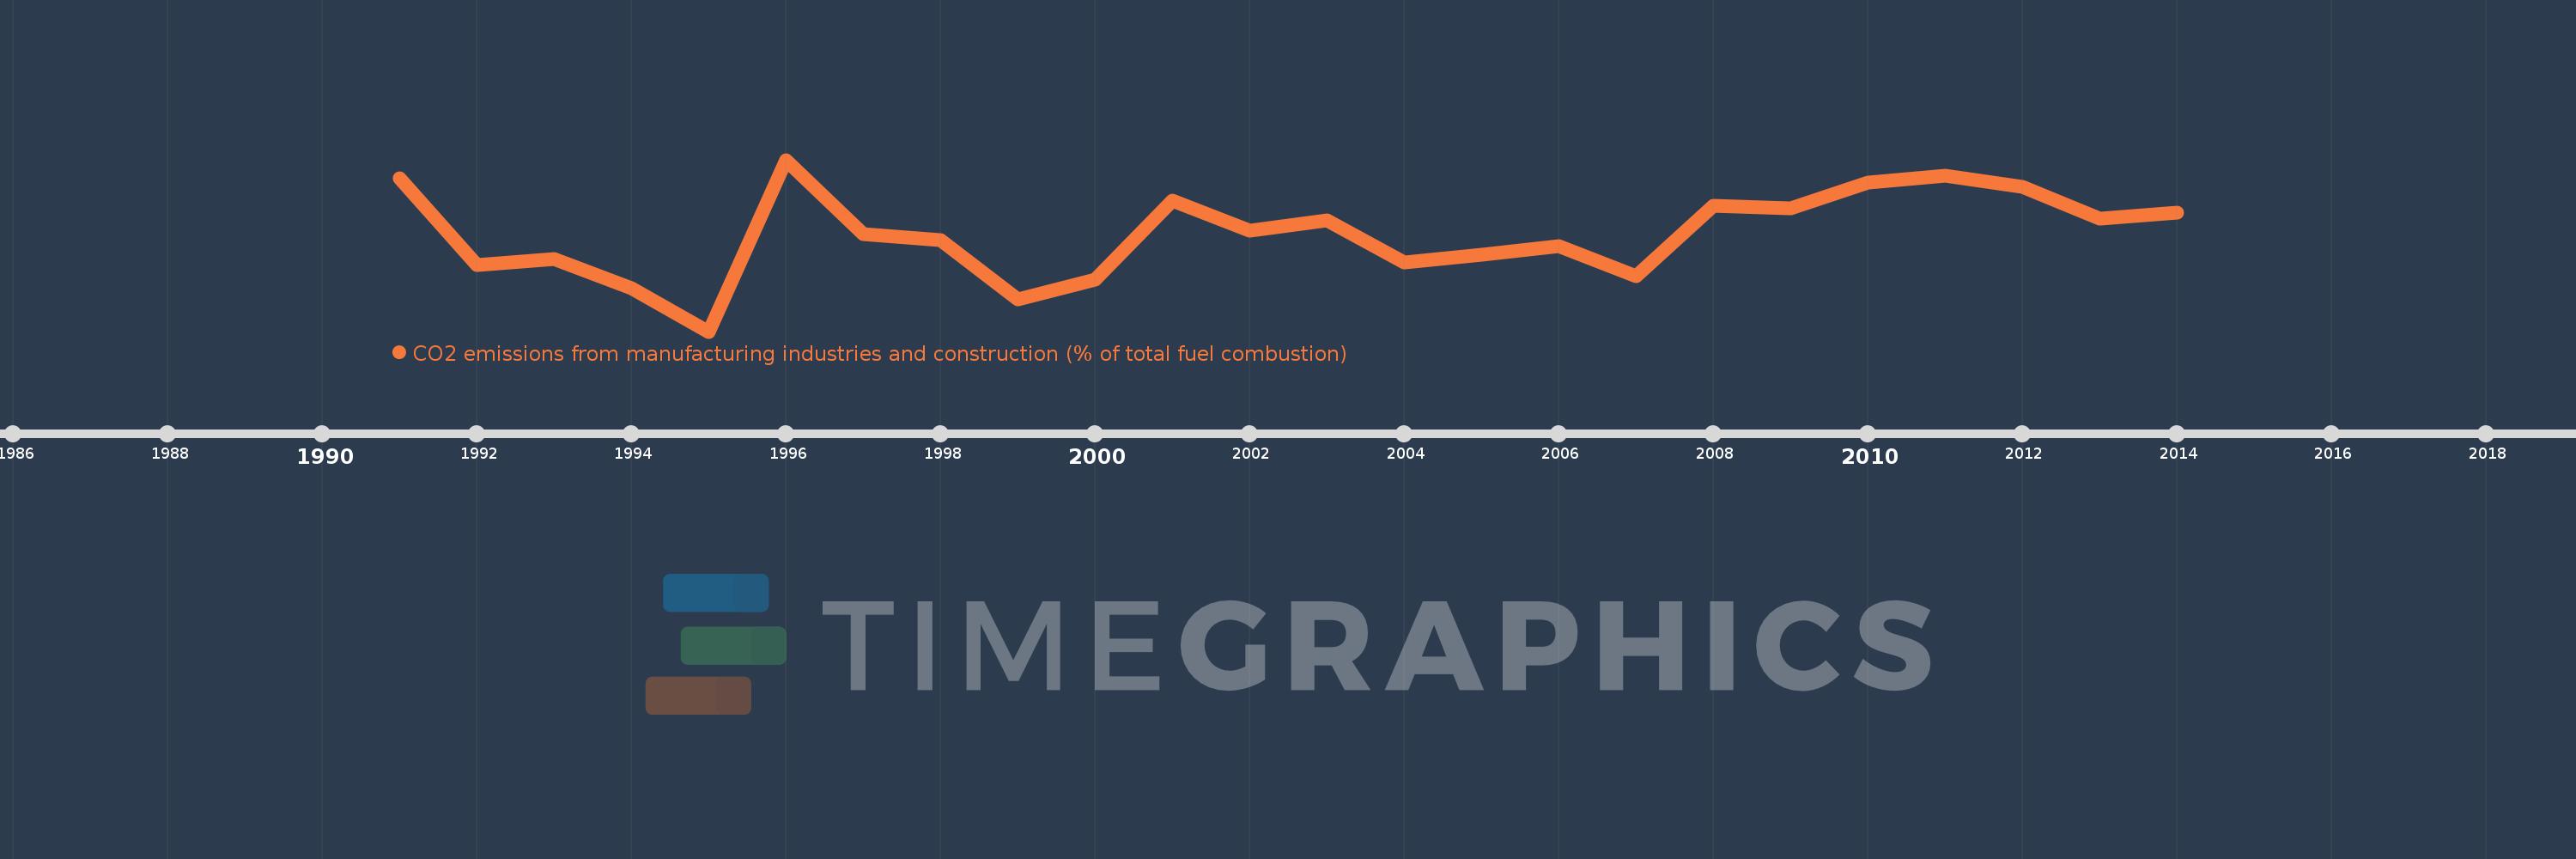
CO2 emissions from manufacturing industries and construction (% of total fuel combustion)
2014,2013,2012,2011,2010,2009,2008,2007,2006,2005,2004,2003,2002,2001,2000,1999,1998,1997,1996,1995,1994,1993,1992,1991
This statistics in other country:
AlbaniaAlgeriaAngolaArab WorldArgentinaArmeniaAustraliaAustriaAzerbaijanBahrainBangladeshBelarusBelgiumBeninBoliviaBosnia and HerzegovinaBotswanaBrazilBrunei DarussalamBulgariaCambodiaCameroonCanadaCaribbean small statesCentral Europe and the BalticsChileChinaColombiaCongo, Dem. Rep.Congo, Rep.Costa RicaCote d'IvoireCroatiaCubaCuracaoCyprusCzech RepublicDenmarkDominican RepublicEarly-demographic dividendEast Asia & PacificEast Asia & Pacific (excluding high income)East Asia & Pacific (IDA & IBRD countries)EcuadorEgypt, Arab Rep.El SalvadorEritreaEstoniaEthiopiaEuro areaEurope & Central AsiaEurope & Central Asia (excluding high income)Europe & Central Asia (IDA & IBRD countries)European UnionFinlandFragile and conflict affected situationsFranceGabonGeorgiaGermanyGhanaGibraltarGreeceGuatemalaHaitiHeavily indebted poor countries (HIPC)High incomeHondurasHong Kong SAR, ChinaHungaryIBRD onlyIcelandIDA & IBRD totalIDA blendIDA onlyIDA totalIndiaIndonesiaIran, Islamic Rep.IraqIrelandIsraelItalyJamaicaJapanJordanKazakhstanKenyaKorea, Dem. People’s Rep.Korea, Rep.KosovoKuwaitKyrgyz RepublicLate-demographic dividendLatin America & Caribbean Latin America & Caribbean (excluding high income)Latin America & the Caribbean (IDA & IBRD countries)LatviaLeast developed countries: UN classificationLebanonLibyaLithuaniaLow & middle incomeLow incomeLower middle incomeLuxembourgMacedonia, FYRMalaysiaMaltaMauritiusMexicoMiddle East & North AfricaMiddle East & North Africa (excluding high income)Middle East & North Africa (IDA & IBRD countries)Middle incomeMoldovaMongoliaMontenegroMoroccoMozambiqueMyanmarNamibiaNepalNetherlandsNew ZealandNicaraguaNigerNigeriaNorth AmericaNorwayOECD membersOmanOther small statesPakistanPanamaParaguayPeruPhilippinesPolandPortugalPost-demographic dividendPre-demographic dividendQatarRomaniaRussian FederationSaudi ArabiaSenegalSerbiaSingaporeSlovak RepublicSloveniaSmall statesSouth AfricaSouth AsiaSouth Asia (IDA & IBRD)South SudanSpainSri LankaSub-Saharan Africa Sub-Saharan Africa (excluding high income)Sub-Saharan Africa (IDA & IBRD countries)SudanSwedenSwitzerlandSyrian Arab RepublicTajikistanTanzaniaThailandTogoTrinidad and TobagoTunisiaTurkeyTurkmenistanUkraineUnited Arab EmiratesUnited KingdomUnited StatesUpper middle incomeUruguayUzbekistanVenezuela, RBVietnamWorldYemen, Rep.ZambiaZimbabwe Timeline:
This timeline shows a graph from 1991 to 2014 of Russian Federation. No data until 1990. Number of actual observations by date: 24.
Source name:
World Development Indicators
Source organization:
IEA Statistics © OECD/IEA 2014 (http://www.iea.org/stats/index.asp), subject to https://www.iea.org/t&c/termsandconditions/
Categories, topics:
Environment
Last updated:
apr 23, 2017
Indicators value changes by year
Maximum:
11.927
jan 1, 1996
At the date of observation
Value
Absolute change
Change from previous value
jan 1, 1991
11.614
+11.614
0.0%
jan 1, 1992
10.112
-1.502
-12.93%
jan 1, 1993
10.213
+0.101
1.0%
jan 1, 1994
9.705
-0.508
-4.97%
jan 1, 1995
8.964
-0.741
-7.63%
jan 1, 1996
11.927
+2.963
33.05%
jan 1, 1997
10.643
-1.284
-10.77%
jan 1, 1998
10.546
-0.097
-0.91%
jan 1, 1999
9.513
-1.033
-9.79%
jan 1, 2000
9.867
+0.354
3.72%
jan 1, 2001
11.224
+1.357
13.75%
jan 1, 2002
10.699
-0.524
-4.67%
jan 1, 2003
10.885
+0.185
1.73%
jan 1, 2004
10.154
-0.731
-6.71%
jan 1, 2005
10.289
+0.135
1.33%
jan 1, 2006
10.444
+0.155
1.51%
jan 1, 2007
9.92
-0.524
-5.02%
jan 1, 2008
11.14
+1.22
12.3%
jan 1, 2009
11.086
-0.054
-0.49%
jan 1, 2010
11.53
+0.444
4.01%
jan 1, 2011
11.66
+0.13
1.12%
jan 1, 2012
11.458
-0.202
-1.73%
jan 1, 2013
10.916
-0.542
-4.73%
jan 1, 2014
11.019
+0.102
0.94%
Ranking of countries by current statistics by years


Comments: