29
/
en
AIzaSyAYiBZKx7MnpbEhh9jyipgxe19OcubqV5w
April 1, 2024
74244
Austria
AUT
true
2
1
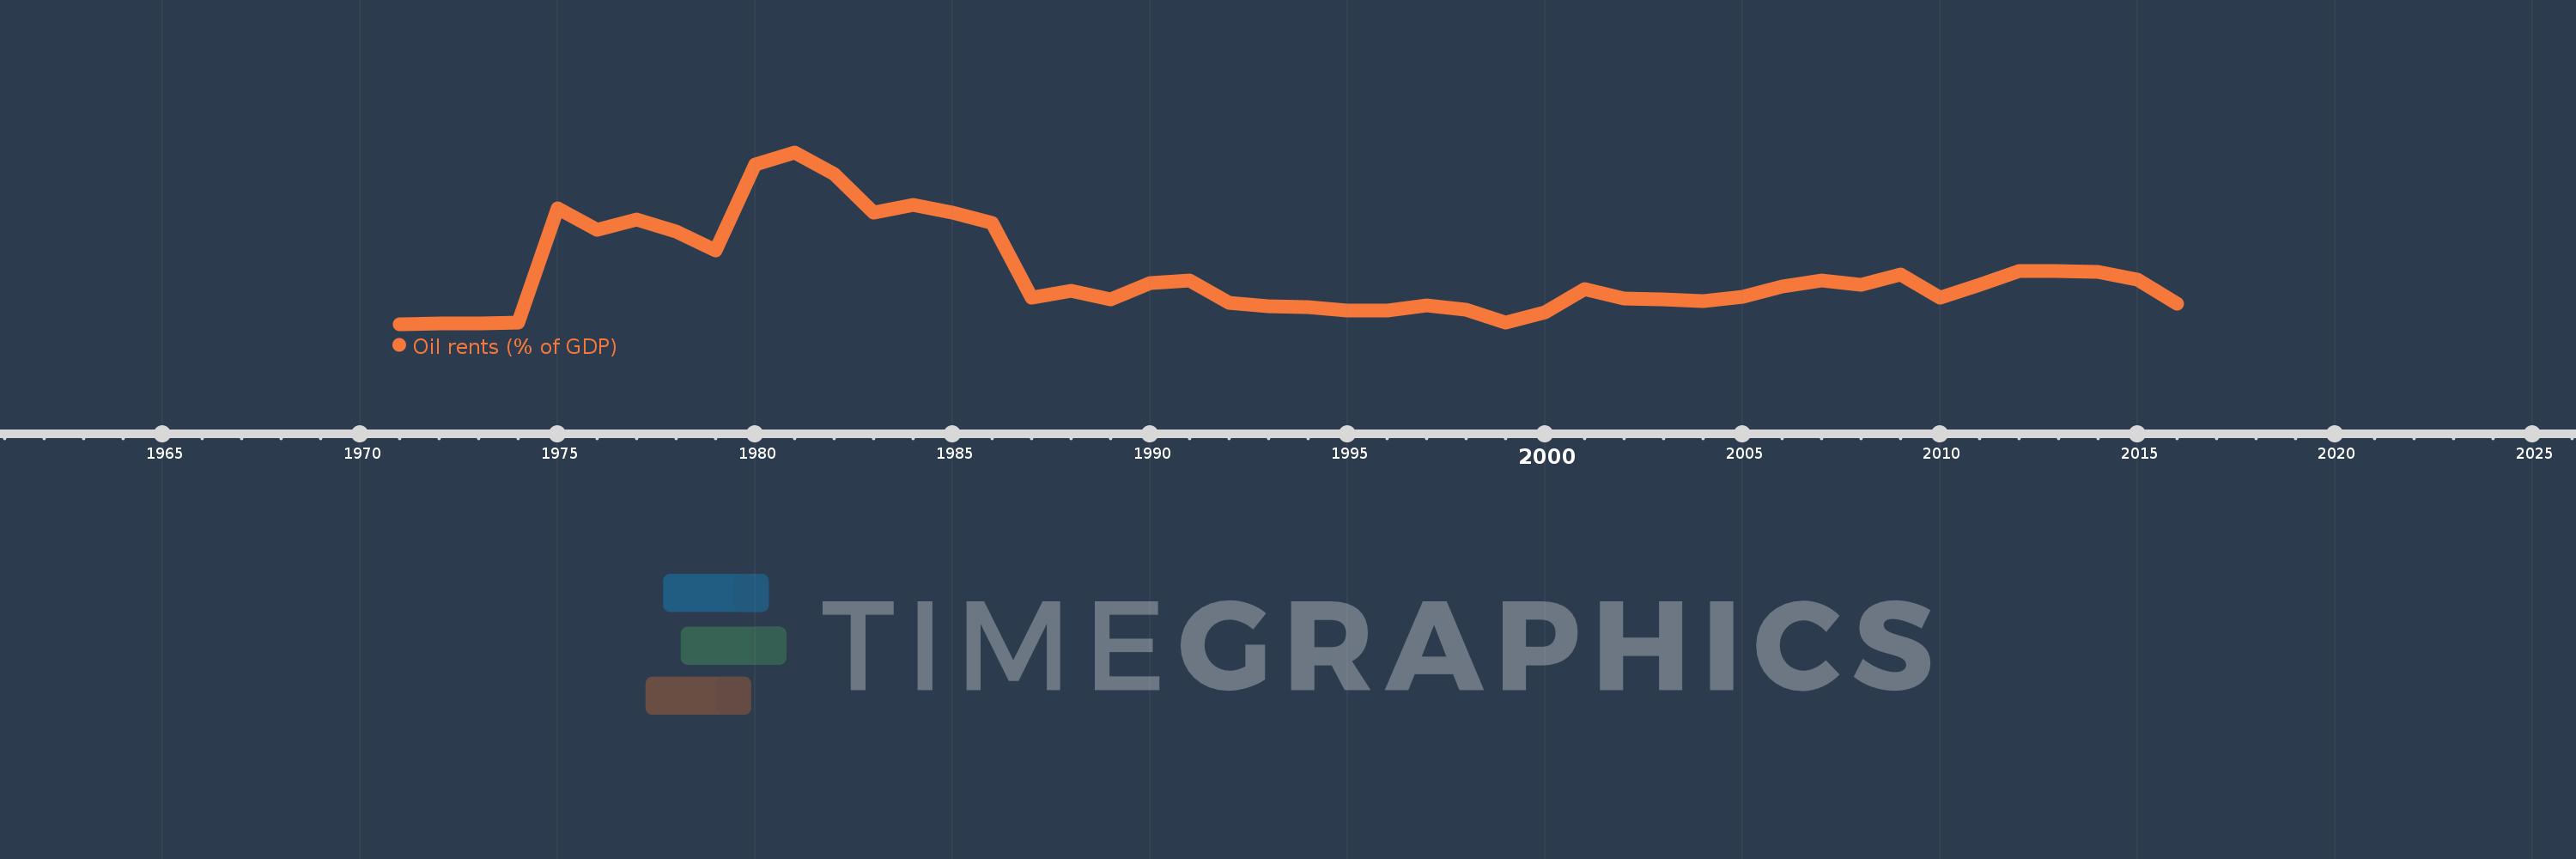
Oil rents (% of GDP)
2016,2015,2014,2013,2012,2011,2010,2009,2008,2007,2006,2005,2004,2003,2002,2001,2000,1999,1998,1997,1996,1995,1994,1993,1992,1991,1990,1989,1988,1987,1986,1985,1984,1983,1982,1981,1980,1979,1978,1977,1976,1975,1974,1973,1972,1971
This statistics in other country:
Timeline:
This timeline shows a graph from 1971 to 2016 of Austria. No data until 1970. Number of actual observations by date: 46.
Source name:
World Development Indicators
Source organization:
Estimates based on sources and methods described in "The Changing Wealth of Nations: Measuring Sustainable Development in the New Millennium" (World Bank, 2011).
Categories, topics:
Energy & Mining, Environment
Last updated:
apr 23, 2017
Indicators value changes by year
At the date of observation
Value
Absolute change
Change from previous value
jan 1, 1971
0.003
+0.003
0.0%
jan 1, 1972
0.004
+0.001
41.51%
jan 1, 1973
0.004
+0.0
0.38%
jan 1, 1974
0.005
+0.001
12.21%
jan 1, 1975
0.18
+0.175
3.67K%
jan 1, 1976
0.148
-0.031
-17.42%
jan 1, 1977
0.163
+0.014
9.71%
jan 1, 1978
0.145
-0.018
-11.14%
jan 1, 1979
0.116
-0.029
-19.99%
jan 1, 1980
0.247
+0.131
113.46%
jan 1, 1981
0.266
+0.019
7.77%
jan 1, 1982
0.233
-0.033
-12.29%
jan 1, 1983
0.174
-0.059
-25.33%
jan 1, 1984
0.185
+0.011
6.16%
jan 1, 1985
0.174
-0.011
-5.93%
jan 1, 1986
0.158
-0.016
-9.02%
jan 1, 1987
0.044
-0.114
-72.24%
jan 1, 1988
0.054
+0.01
23.41%
jan 1, 1989
0.041
-0.013
-23.56%
jan 1, 1990
0.066
+0.024
58.91%
jan 1, 1991
0.07
+0.005
6.91%
jan 1, 1992
0.036
-0.034
-48.19%
jan 1, 1993
0.03
-0.006
-16.84%
jan 1, 1994
0.029
-0.002
-5.58%
jan 1, 1995
0.024
-0.004
-15.21%
jan 1, 1996
0.024
0.0
-1.64%
jan 1, 1997
0.032
+0.008
34.48%
jan 1, 1998
0.025
-0.007
-21.4%
jan 1, 1999
0.006
-0.02
-77.69%
jan 1, 2000
0.021
+0.016
279.09%
jan 1, 2001
0.057
+0.035
165.69%
jan 1, 2002
0.042
-0.015
-26.84%
jan 1, 2003
0.041
-0.001
-2.26%
jan 1, 2004
0.038
-0.003
-6.92%
jan 1, 2005
0.045
+0.007
19.26%
jan 1, 2006
0.061
+0.016
35.7%
jan 1, 2007
0.07
+0.009
14.48%
jan 1, 2008
0.064
-0.006
-8.73%
jan 1, 2009
0.079
+0.015
22.92%
jan 1, 2010
0.043
-0.036
-45.6%
jan 1, 2011
0.063
+0.021
48.61%
jan 1, 2012
0.085
+0.021
33.23%
jan 1, 2013
0.084
0.0
-0.37%
jan 1, 2014
0.083
-0.002
-2.06%
jan 1, 2015
0.071
-0.012
-14.53%
jan 1, 2016
0.034
-0.036
-51.51%
Ranking of countries by current statistics by years


Comments: