29
/
en
AIzaSyAYiBZKx7MnpbEhh9jyipgxe19OcubqV5w
April 1, 2024
37659
IDA & IBRD total
IBT
false
2
1
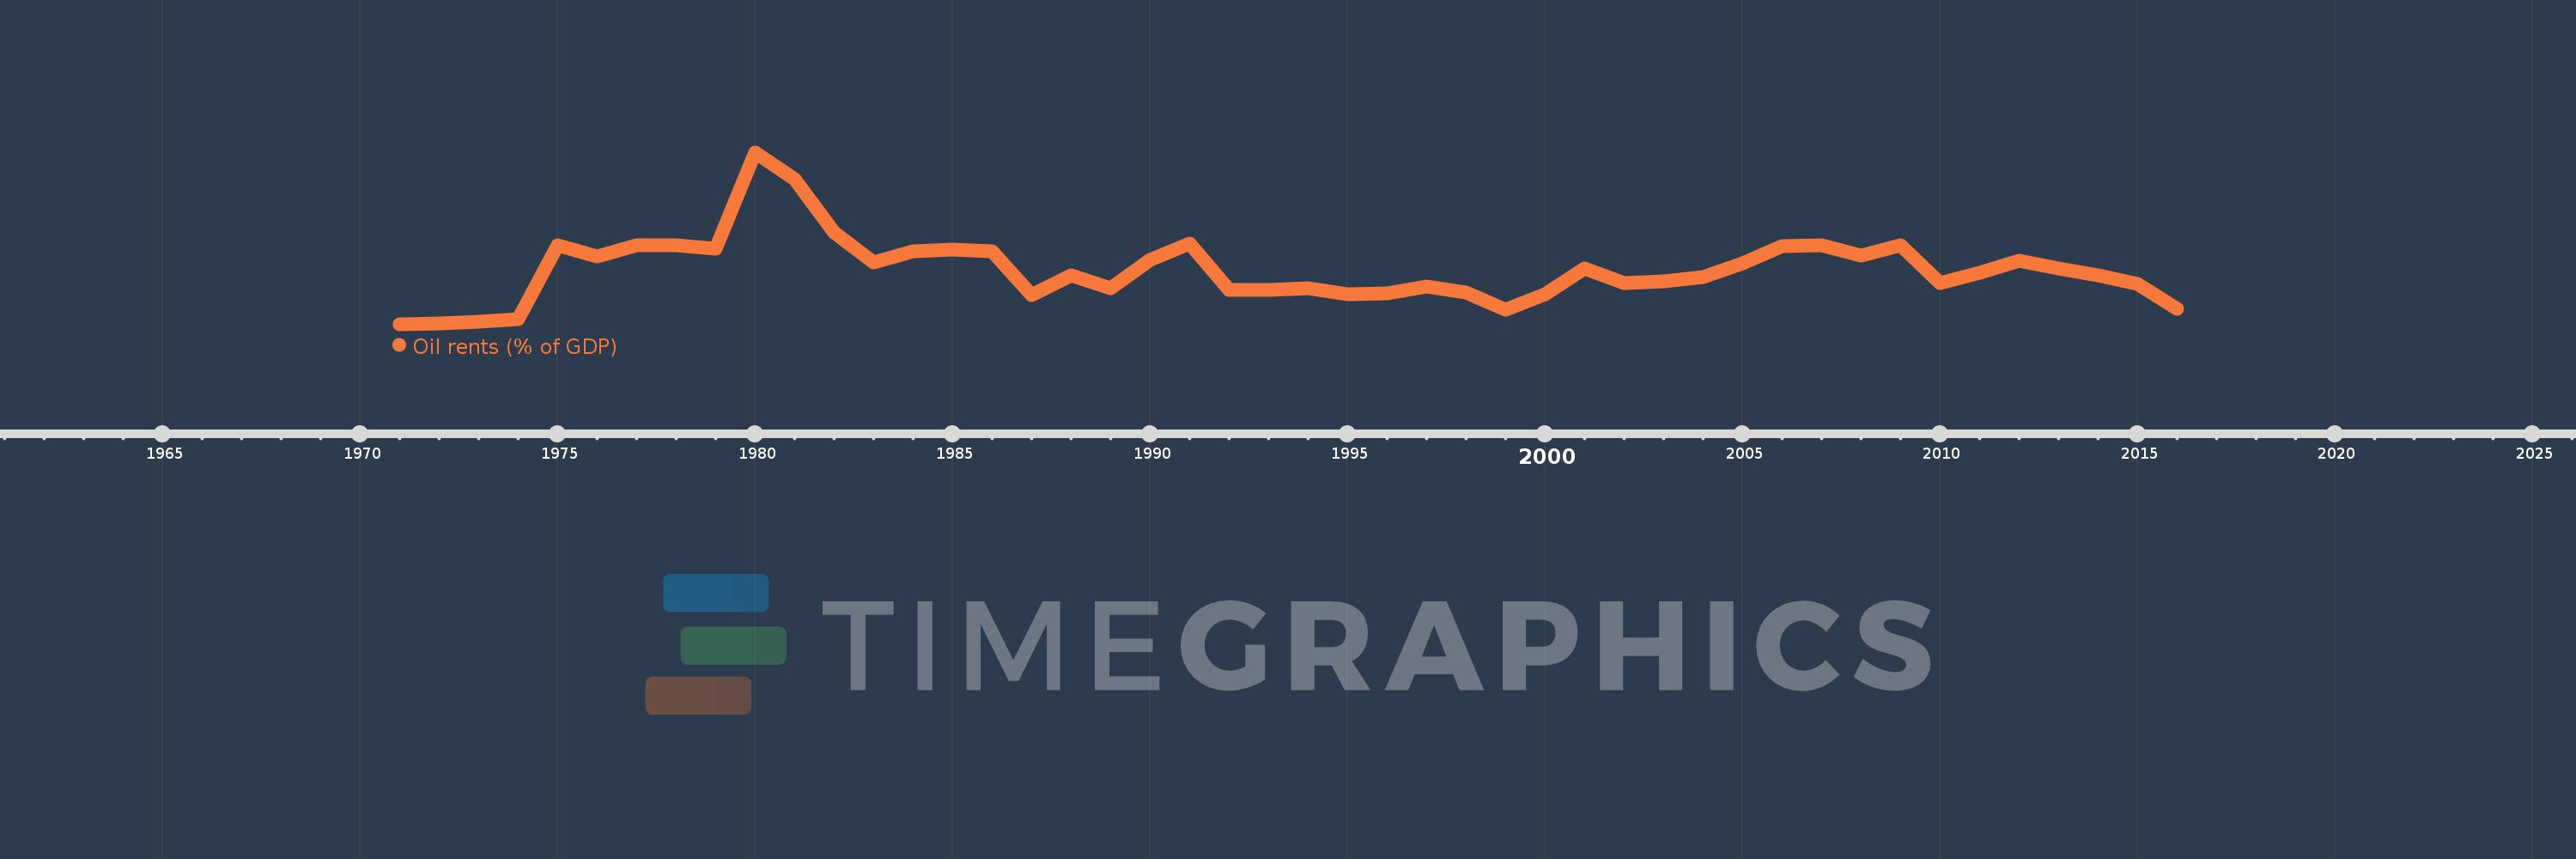
Oil rents (% of GDP)
2016,2015,2014,2013,2012,2011,2010,2009,2008,2007,2006,2005,2004,2003,2002,2001,2000,1999,1998,1997,1996,1995,1994,1993,1992,1991,1990,1989,1988,1987,1986,1985,1984,1983,1982,1981,1980,1979,1978,1977,1976,1975,1974,1973,1972,1971
This statistics in other country:
Timeline:
This timeline shows a graph from 1971 to 2016 of IDA & IBRD total. No data until 1970. Number of actual observations by date: 46.
Source name:
World Development Indicators
Source organization:
Estimates based on sources and methods described in "The Changing Wealth of Nations: Measuring Sustainable Development in the New Millennium" (World Bank, 2011).
Categories, topics:
Energy & Mining, Environment
Last updated:
apr 23, 2017
Indicators value changes by year
Maximum:
12.873
jan 1, 1980
At the date of observation
Value
Absolute change
Change from previous value
jan 1, 1971
0.013
+0.013
0.0%
jan 1, 1972
0.055
+0.042
330.71%
jan 1, 1973
0.171
+0.116
211.6%
jan 1, 1974
0.405
+0.233
136.07%
jan 1, 1975
5.899
+5.494
1.36K%
jan 1, 1976
5.063
-0.836
-14.17%
jan 1, 1977
5.894
+0.831
16.41%
jan 1, 1978
5.903
+0.01
0.17%
jan 1, 1979
5.645
-0.258
-4.38%
jan 1, 1980
12.873
+7.228
128.03%
jan 1, 1981
10.878
-1.994
-15.49%
jan 1, 1982
6.899
-3.98
-36.58%
jan 1, 1983
4.614
-2.284
-33.11%
jan 1, 1984
5.447
+0.833
18.04%
jan 1, 1985
5.626
+0.179
3.29%
jan 1, 1986
5.496
-0.13
-2.32%
jan 1, 1987
2.197
-3.299
-60.03%
jan 1, 1988
3.647
+1.45
65.99%
jan 1, 1989
2.713
-0.934
-25.61%
jan 1, 1990
4.808
+2.095
77.25%
jan 1, 1991
6.046
+1.238
25.74%
jan 1, 1992
2.585
-3.461
-57.24%
jan 1, 1993
2.607
+0.022
0.86%
jan 1, 1994
2.702
+0.095
3.64%
jan 1, 1995
2.285
-0.417
-15.44%
jan 1, 1996
2.318
+0.033
1.45%
jan 1, 1997
2.851
+0.533
23.0%
jan 1, 1998
2.384
-0.467
-16.37%
jan 1, 1999
1.126
-1.259
-52.79%
jan 1, 2000
2.233
+1.108
98.39%
jan 1, 2001
4.17
+1.937
86.74%
jan 1, 2002
3.092
-1.078
-25.86%
jan 1, 2003
3.203
+0.111
3.6%
jan 1, 2004
3.524
+0.32
10.0%
jan 1, 2005
4.541
+1.018
28.88%
jan 1, 2006
5.877
+1.335
29.4%
jan 1, 2007
5.949
+0.073
1.24%
jan 1, 2008
5.148
-0.801
-13.46%
jan 1, 2009
5.915
+0.766
14.89%
jan 1, 2010
3.104
-2.811
-47.53%
jan 1, 2011
3.845
+0.742
23.9%
jan 1, 2012
4.785
+0.939
24.43%
jan 1, 2013
4.178
-0.607
-12.68%
jan 1, 2014
3.644
-0.534
-12.79%
jan 1, 2015
3.018
-0.626
-17.18%
jan 1, 2016
1.137
-1.88
-62.32%
Ranking of countries by current statistics by years


Comments: