29
/
en
AIzaSyAYiBZKx7MnpbEhh9jyipgxe19OcubqV5w
April 1, 2024
44535
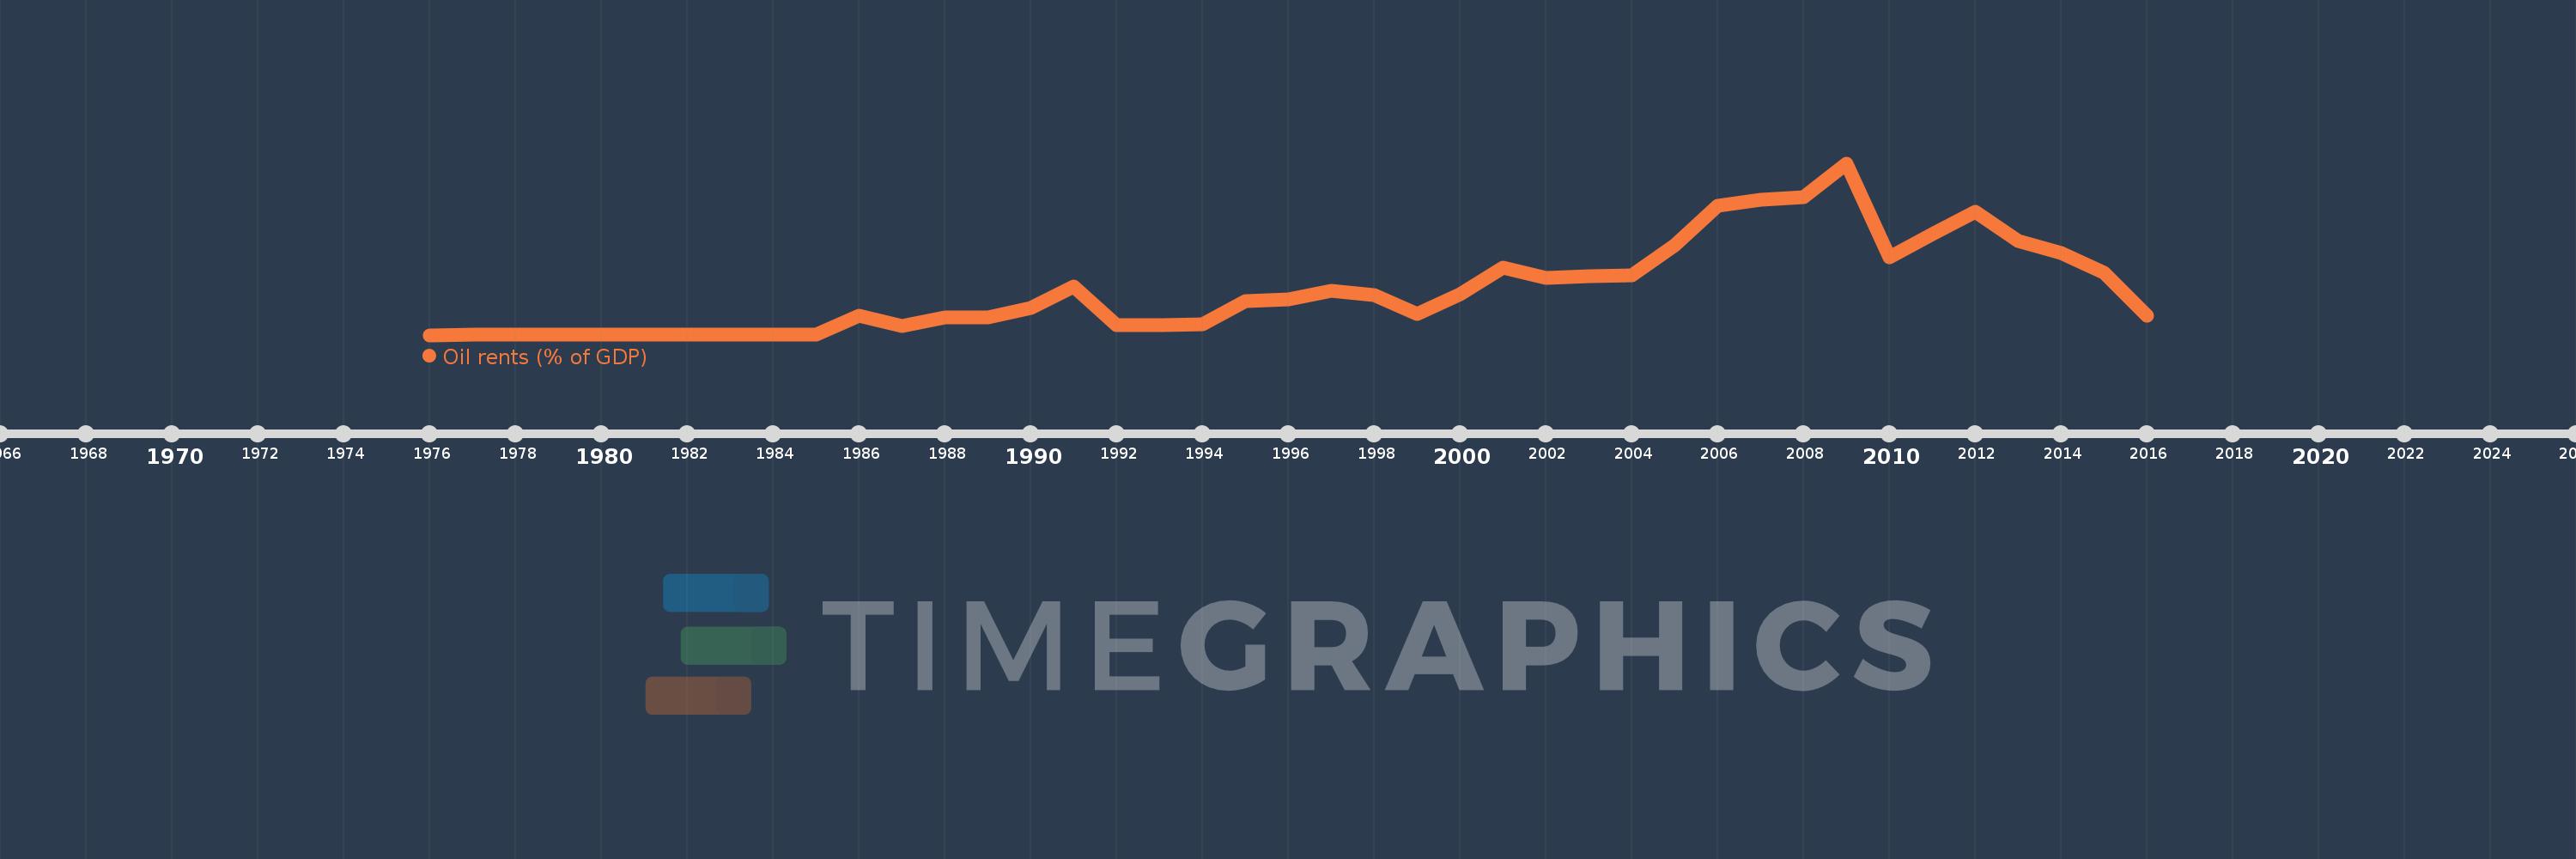
Least developed countries: UN classification
LDC
false
2
1
Oil rents (% of GDP)
2016,2015,2014,2013,2012,2011,2010,2009,2008,2007,2006,2005,2004,2003,2002,2001,2000,1999,1998,1997,1996,1995,1994,1993,1992,1991,1990,1989,1988,1987,1986,1985,1984,1983,1982,1981,1980,1977,1976
This statistics in other country:
Timeline:
This timeline shows a graph from 1976 to 2016 of Least developed countries: UN classification. No data until 1975. Number of actual observations by date: 39.
Source name:
World Development Indicators
Source organization:
Estimates based on sources and methods described in "The Changing Wealth of Nations: Measuring Sustainable Development in the New Millennium" (World Bank, 2011).
Categories, topics:
Energy & Mining, Environment
Last updated:
apr 23, 2017
Indicators value changes by year
Maximum:
19.444
jan 1, 2009
At the date of observation
Value
Absolute change
Change from previous value
jan 1, 1977
0.002
+0.002
6.99K%
jan 1, 1980
0.009
+0.007
321.85%
jan 1, 1981
0.005
-0.004
-42.52%
jan 1, 1982
0.059
+0.054
1.01K%
jan 1, 1983
0.043
-0.016
-27.17%
jan 1, 1984
0.005
-0.038
-87.56%
jan 1, 1985
0.001
-0.004
-79.3%
jan 1, 1986
2.182
+2.181
196.07K%
jan 1, 1987
1.048
-1.133
-51.94%
jan 1, 1988
2.025
+0.977
93.18%
jan 1, 1989
2.029
+0.003
0.16%
jan 1, 1990
3.025
+0.996
49.11%
jan 1, 1991
5.513
+2.488
82.25%
jan 1, 1992
1.082
-4.431
-80.38%
jan 1, 1993
1.1
+0.019
1.72%
jan 1, 1994
1.243
+0.143
12.97%
jan 1, 1995
3.852
+2.608
209.85%
jan 1, 1996
4.017
+0.166
4.31%
jan 1, 1997
5.052
+1.035
25.75%
jan 1, 1998
4.481
-0.571
-11.3%
jan 1, 1999
2.355
-2.127
-47.46%
jan 1, 2000
4.592
+2.238
95.04%
jan 1, 2001
7.635
+3.043
66.27%
jan 1, 2002
6.43
-1.205
-15.78%
jan 1, 2003
6.663
+0.233
3.62%
jan 1, 2004
6.721
+0.058
0.87%
jan 1, 2005
10.166
+3.445
51.25%
jan 1, 2006
14.641
+4.475
44.02%
jan 1, 2007
15.295
+0.653
4.46%
jan 1, 2008
15.611
+0.317
2.07%
jan 1, 2009
19.444
+3.833
24.55%
jan 1, 2010
8.769
-10.675
-54.9%
jan 1, 2011
11.454
+2.685
30.62%
jan 1, 2012
13.934
+2.48
21.66%
jan 1, 2013
10.628
-3.306
-23.72%
jan 1, 2014
9.329
-1.3
-12.23%
jan 1, 2015
7.083
-2.246
-24.07%
jan 1, 2016
2.147
-4.936
-69.68%
Ranking of countries by current statistics by years


Comments: