29
/
en
AIzaSyAYiBZKx7MnpbEhh9jyipgxe19OcubqV5w
April 1, 2024
127676
Equatorial Guinea
GNQ
true
2
1
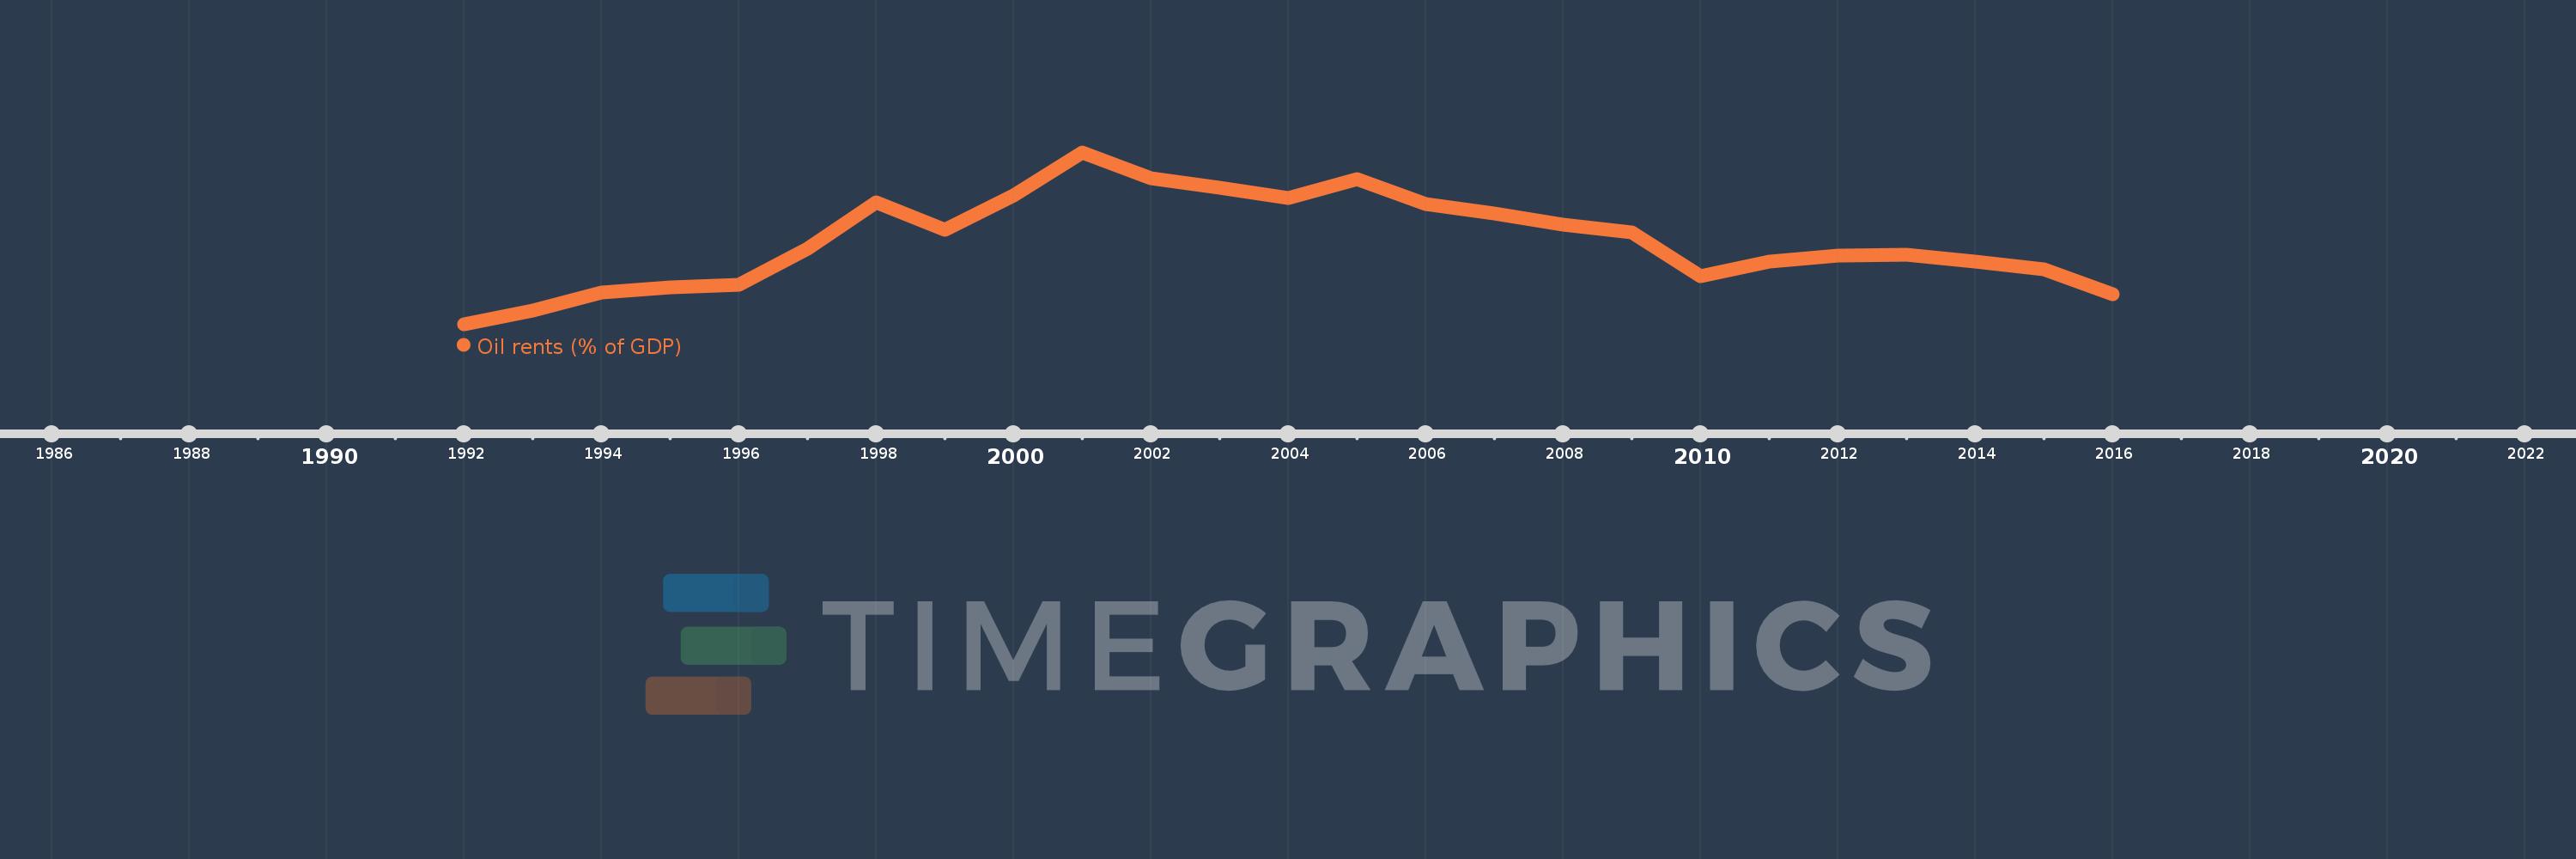
Oil rents (% of GDP)
2016,2015,2014,2013,2012,2011,2010,2009,2008,2007,2006,2005,2004,2003,2002,2001,2000,1999,1998,1997,1996,1995,1994,1993,1992
This statistics in other country:
Timeline:
This timeline shows a graph from 1992 to 2016 of Equatorial Guinea. No data until 1991. Number of actual observations by date: 25.
Source name:
World Development Indicators
Source organization:
Estimates based on sources and methods described in "The Changing Wealth of Nations: Measuring Sustainable Development in the New Millennium" (World Bank, 2011).
Categories, topics:
Energy & Mining, Environment
Last updated:
apr 23, 2017
Indicators value changes by year
Maximum:
83.344
jan 1, 2001
At the date of observation
Value
Absolute change
Change from previous value
jan 1, 1992
0.381
+0.381
0.0%
jan 1, 1993
6.779
+6.398
1.68K%
jan 1, 1994
15.517
+8.738
128.89%
jan 1, 1995
18.057
+2.54
16.37%
jan 1, 1996
19.258
+1.201
6.65%
jan 1, 1997
36.835
+17.576
91.27%
jan 1, 1998
59.4
+22.566
61.26%
jan 1, 1999
45.794
-13.606
-22.91%
jan 1, 2000
62.696
+16.902
36.91%
jan 1, 2001
83.344
+20.648
32.93%
jan 1, 2002
70.719
-12.625
-15.15%
jan 1, 2003
66.102
-4.617
-6.53%
jan 1, 2004
61.153
-4.949
-7.49%
jan 1, 2005
70.307
+9.155
14.97%
jan 1, 2006
58.479
-11.828
-16.82%
jan 1, 2007
53.878
-4.602
-7.87%
jan 1, 2008
48.495
-5.383
-9.99%
jan 1, 2009
44.802
-3.692
-7.61%
jan 1, 2010
23.622
-21.18
-47.27%
jan 1, 2011
30.468
+6.846
28.98%
jan 1, 2012
33.536
+3.067
10.07%
jan 1, 2013
33.872
+0.337
1.0%
jan 1, 2014
30.586
-3.286
-9.7%
jan 1, 2015
26.944
-3.642
-11.91%
jan 1, 2016
14.729
-12.216
-45.34%
Ranking of countries by current statistics by years


Comments: