29
/
en
AIzaSyAYiBZKx7MnpbEhh9jyipgxe19OcubqV5w
April 1, 2024
225233
Poland
POL
true
2
1
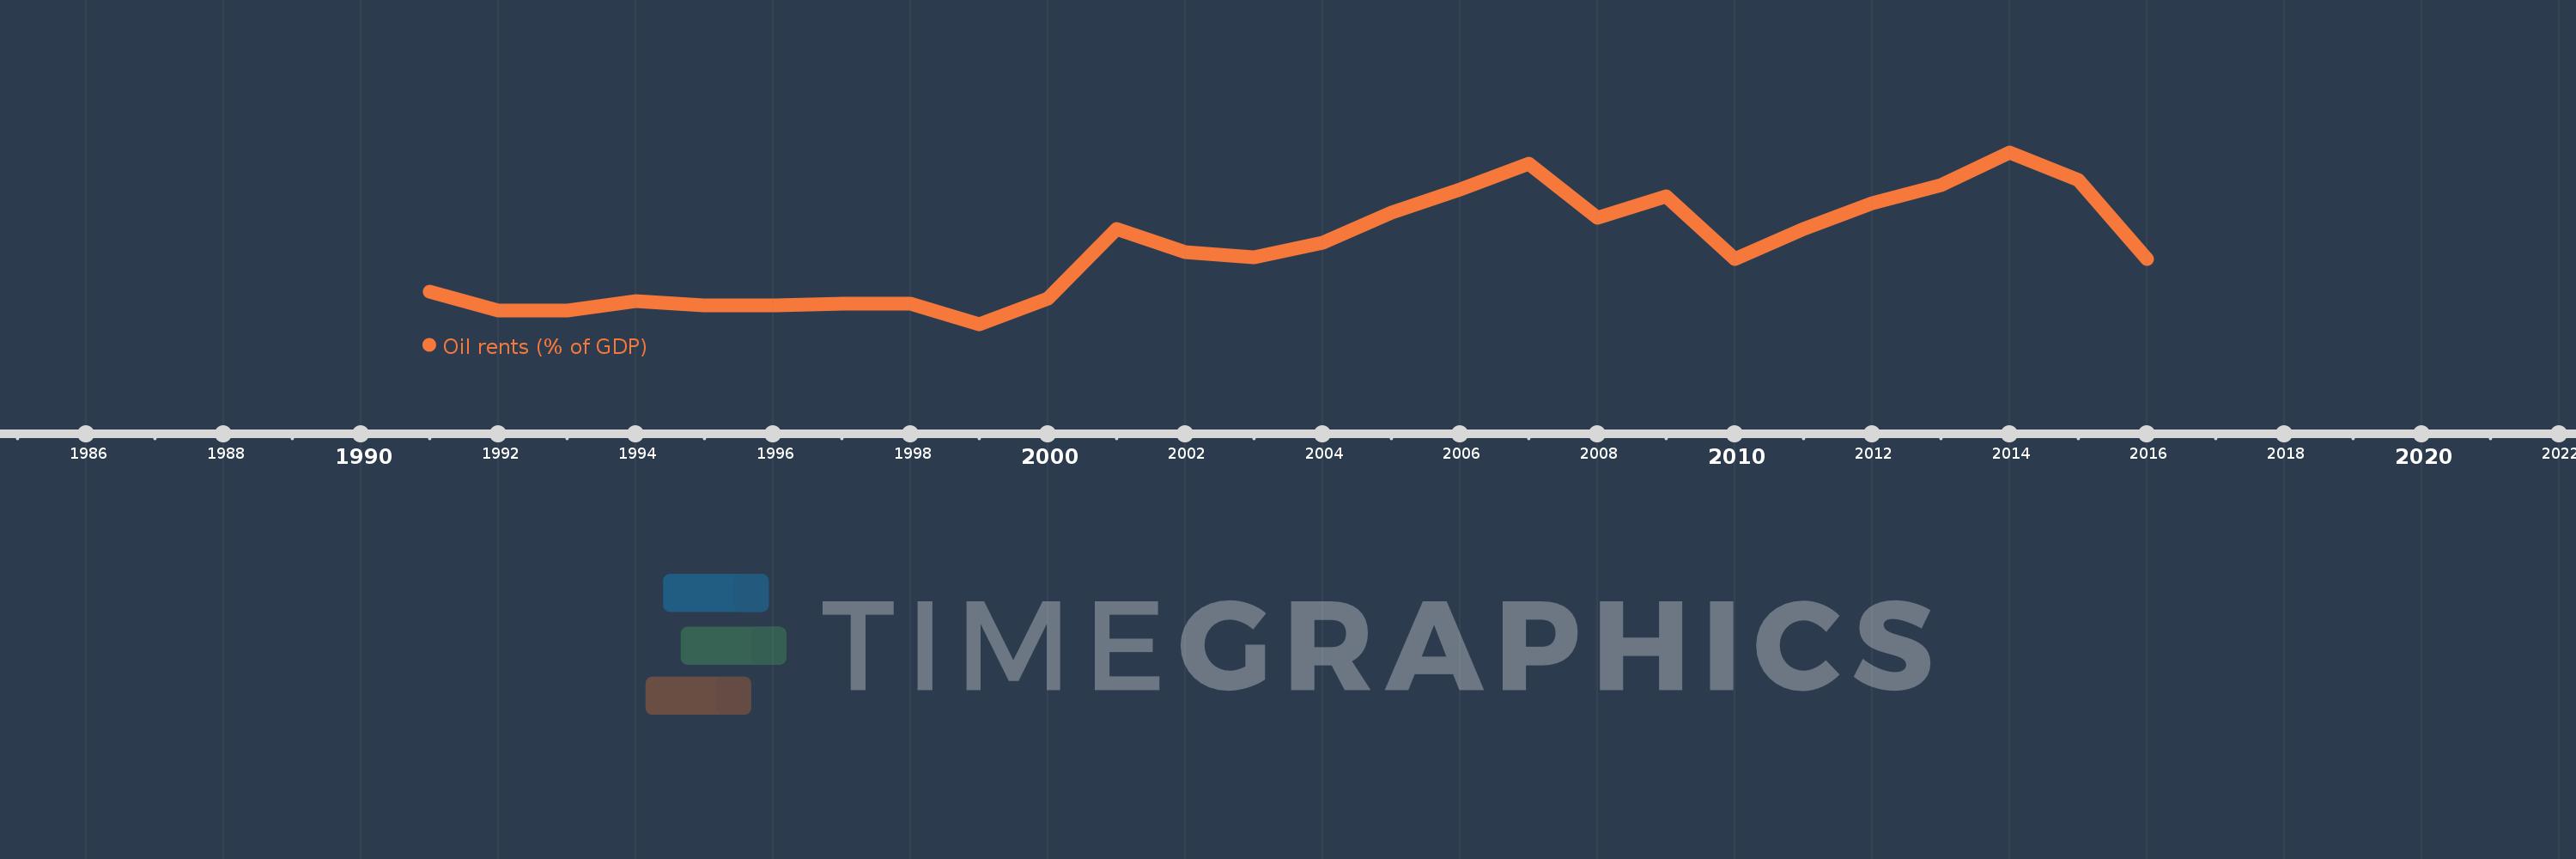
Oil rents (% of GDP)
2016,2015,2014,2013,2012,2011,2010,2009,2008,2007,2006,2005,2004,2003,2002,2001,2000,1999,1998,1997,1996,1995,1994,1993,1992,1991
This statistics in other country:
Timeline:
This timeline shows a graph from 1991 to 2016 of Poland. No data until 1990. Number of actual observations by date: 26.
Source name:
World Development Indicators
Source organization:
Estimates based on sources and methods described in "The Changing Wealth of Nations: Measuring Sustainable Development in the New Millennium" (World Bank, 2011).
Categories, topics:
Energy & Mining, Environment
Last updated:
apr 23, 2017
Indicators value changes by year
At the date of observation
Value
Absolute change
Change from previous value
jan 1, 1991
0.016
+0.016
0.0%
jan 1, 1992
0.008
-0.008
-46.93%
jan 1, 1993
0.008
+0.0
0.05%
jan 1, 1994
0.012
+0.004
46.86%
jan 1, 1995
0.01
-0.002
-17.52%
jan 1, 1996
0.01
-0.001
-6.6%
jan 1, 1997
0.011
+0.002
18.25%
jan 1, 1998
0.011
-0.001
-6.37%
jan 1, 1999
0.002
-0.008
-76.94%
jan 1, 2000
0.013
+0.011
443.12%
jan 1, 2001
0.043
+0.03
224.24%
jan 1, 2002
0.033
-0.01
-23.79%
jan 1, 2003
0.031
-0.002
-5.84%
jan 1, 2004
0.037
+0.006
20.88%
jan 1, 2005
0.05
+0.013
33.74%
jan 1, 2006
0.06
+0.01
20.61%
jan 1, 2007
0.071
+0.01
16.8%
jan 1, 2008
0.048
-0.022
-31.44%
jan 1, 2009
0.057
+0.009
17.58%
jan 1, 2010
0.03
-0.027
-47.29%
jan 1, 2011
0.043
+0.013
42.84%
jan 1, 2012
0.054
+0.011
26.62%
jan 1, 2013
0.062
+0.008
13.98%
jan 1, 2014
0.076
+0.014
22.86%
jan 1, 2015
0.064
-0.012
-15.29%
jan 1, 2016
0.03
-0.035
-53.82%
Ranking of countries by current statistics by years


Comments: