29
/
en
AIzaSyAYiBZKx7MnpbEhh9jyipgxe19OcubqV5w
April 1, 2024
58410
South Asia (IDA & IBRD)
TSA
false
2
1
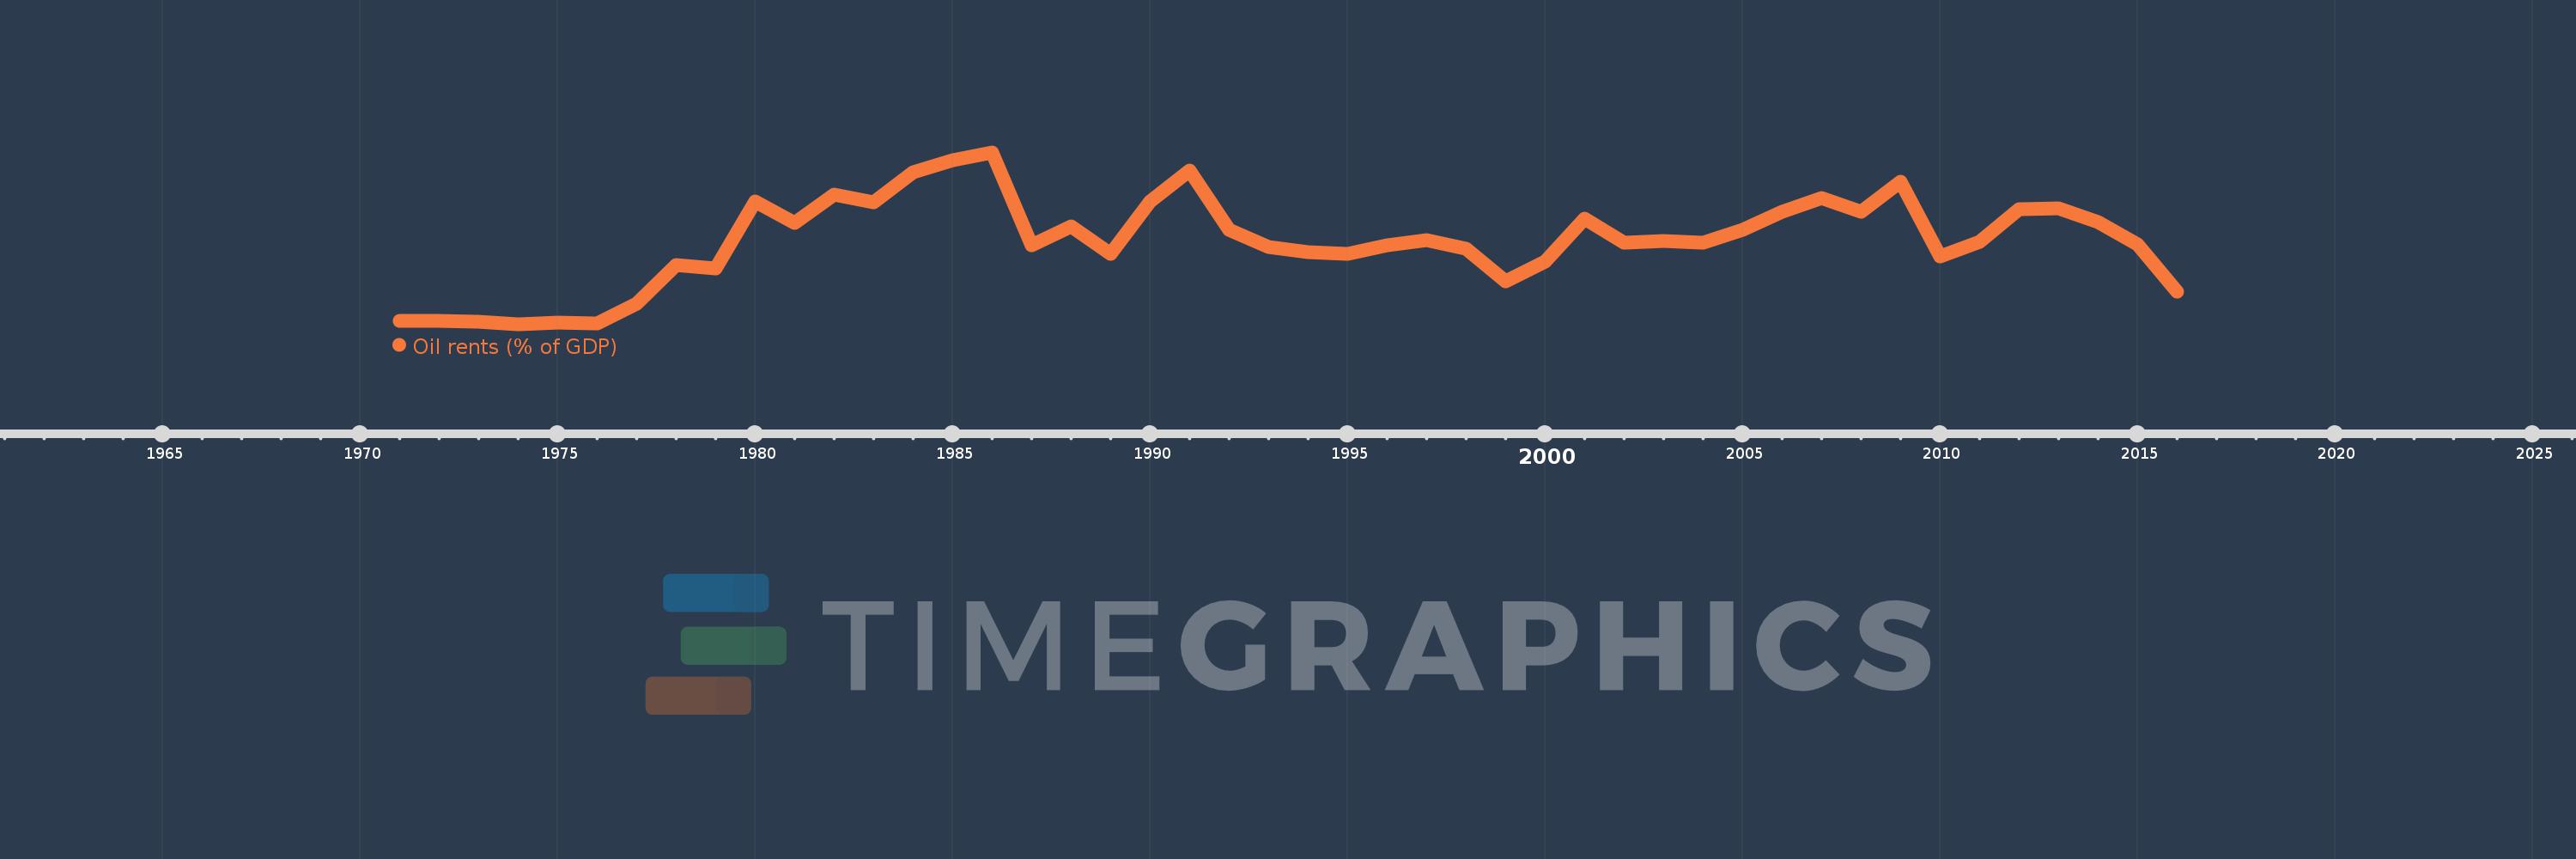
Oil rents (% of GDP)
2016,2015,2014,2013,2012,2011,2010,2009,2008,2007,2006,2005,2004,2003,2002,2001,2000,1999,1998,1997,1996,1995,1994,1993,1992,1991,1990,1989,1988,1987,1986,1985,1984,1983,1982,1981,1980,1979,1978,1977,1976,1975,1974,1973,1972,1971
This statistics in other country:
Timeline:
This timeline shows a graph from 1971 to 2016 of South Asia (IDA & IBRD). No data until 1970. Number of actual observations by date: 46.
Source name:
World Development Indicators
Source organization:
Estimates based on sources and methods described in "The Changing Wealth of Nations: Measuring Sustainable Development in the New Millennium" (World Bank, 2011).
Categories, topics:
Energy & Mining, Environment
Last updated:
apr 23, 2017
Indicators value changes by year
At the date of observation
Value
Absolute change
Change from previous value
jan 1, 1971
0.037
+0.037
0.0%
jan 1, 1972
0.037
-0.001
-2.2%
jan 1, 1973
0.023
-0.013
-36.77%
jan 1, 1974
0.002
-0.021
-92.78%
jan 1, 1975
0.017
+0.015
926.12%
jan 1, 1976
0.013
-0.004
-23.9%
jan 1, 1977
0.201
+0.188
1.44K%
jan 1, 1978
0.579
+0.378
188.55%
jan 1, 1979
0.542
-0.038
-6.49%
jan 1, 1980
1.2
+0.658
121.52%
jan 1, 1981
0.989
-0.211
-17.56%
jan 1, 1982
1.267
+0.278
28.13%
jan 1, 1983
1.189
-0.078
-6.16%
jan 1, 1984
1.483
+0.294
24.7%
jan 1, 1985
1.596
+0.113
7.6%
jan 1, 1986
1.675
+0.079
4.98%
jan 1, 1987
0.774
-0.901
-53.79%
jan 1, 1988
0.957
+0.183
23.64%
jan 1, 1989
0.69
-0.267
-27.88%
jan 1, 1990
1.195
+0.505
73.12%
jan 1, 1991
1.497
+0.302
25.25%
jan 1, 1992
0.921
-0.576
-38.46%
jan 1, 1993
0.755
-0.166
-18.02%
jan 1, 1994
0.704
-0.051
-6.77%
jan 1, 1995
0.689
-0.015
-2.17%
jan 1, 1996
0.77
+0.081
11.83%
jan 1, 1997
0.824
+0.054
6.95%
jan 1, 1998
0.74
-0.084
-10.22%
jan 1, 1999
0.423
-0.317
-42.8%
jan 1, 2000
0.613
+0.19
44.94%
jan 1, 2001
1.034
+0.42
68.57%
jan 1, 2002
0.8
-0.234
-22.63%
jan 1, 2003
0.81
+0.01
1.23%
jan 1, 2004
0.793
-0.017
-2.06%
jan 1, 2005
0.922
+0.129
16.32%
jan 1, 2006
1.095
+0.173
18.7%
jan 1, 2007
1.232
+0.137
12.55%
jan 1, 2008
1.093
-0.139
-11.28%
jan 1, 2009
1.386
+0.292
26.75%
jan 1, 2010
0.658
-0.728
-52.53%
jan 1, 2011
0.806
+0.148
22.54%
jan 1, 2012
1.12
+0.314
38.98%
jan 1, 2013
1.13
+0.01
0.87%
jan 1, 2014
0.993
-0.137
-12.13%
jan 1, 2015
0.781
-0.212
-21.36%
jan 1, 2016
0.322
-0.459
-58.8%
Ranking of countries by current statistics by years


Comments: