29
/
en
AIzaSyAYiBZKx7MnpbEhh9jyipgxe19OcubqV5w
April 1, 2024
48419
Middle East & North Africa
MEA
false
2
1
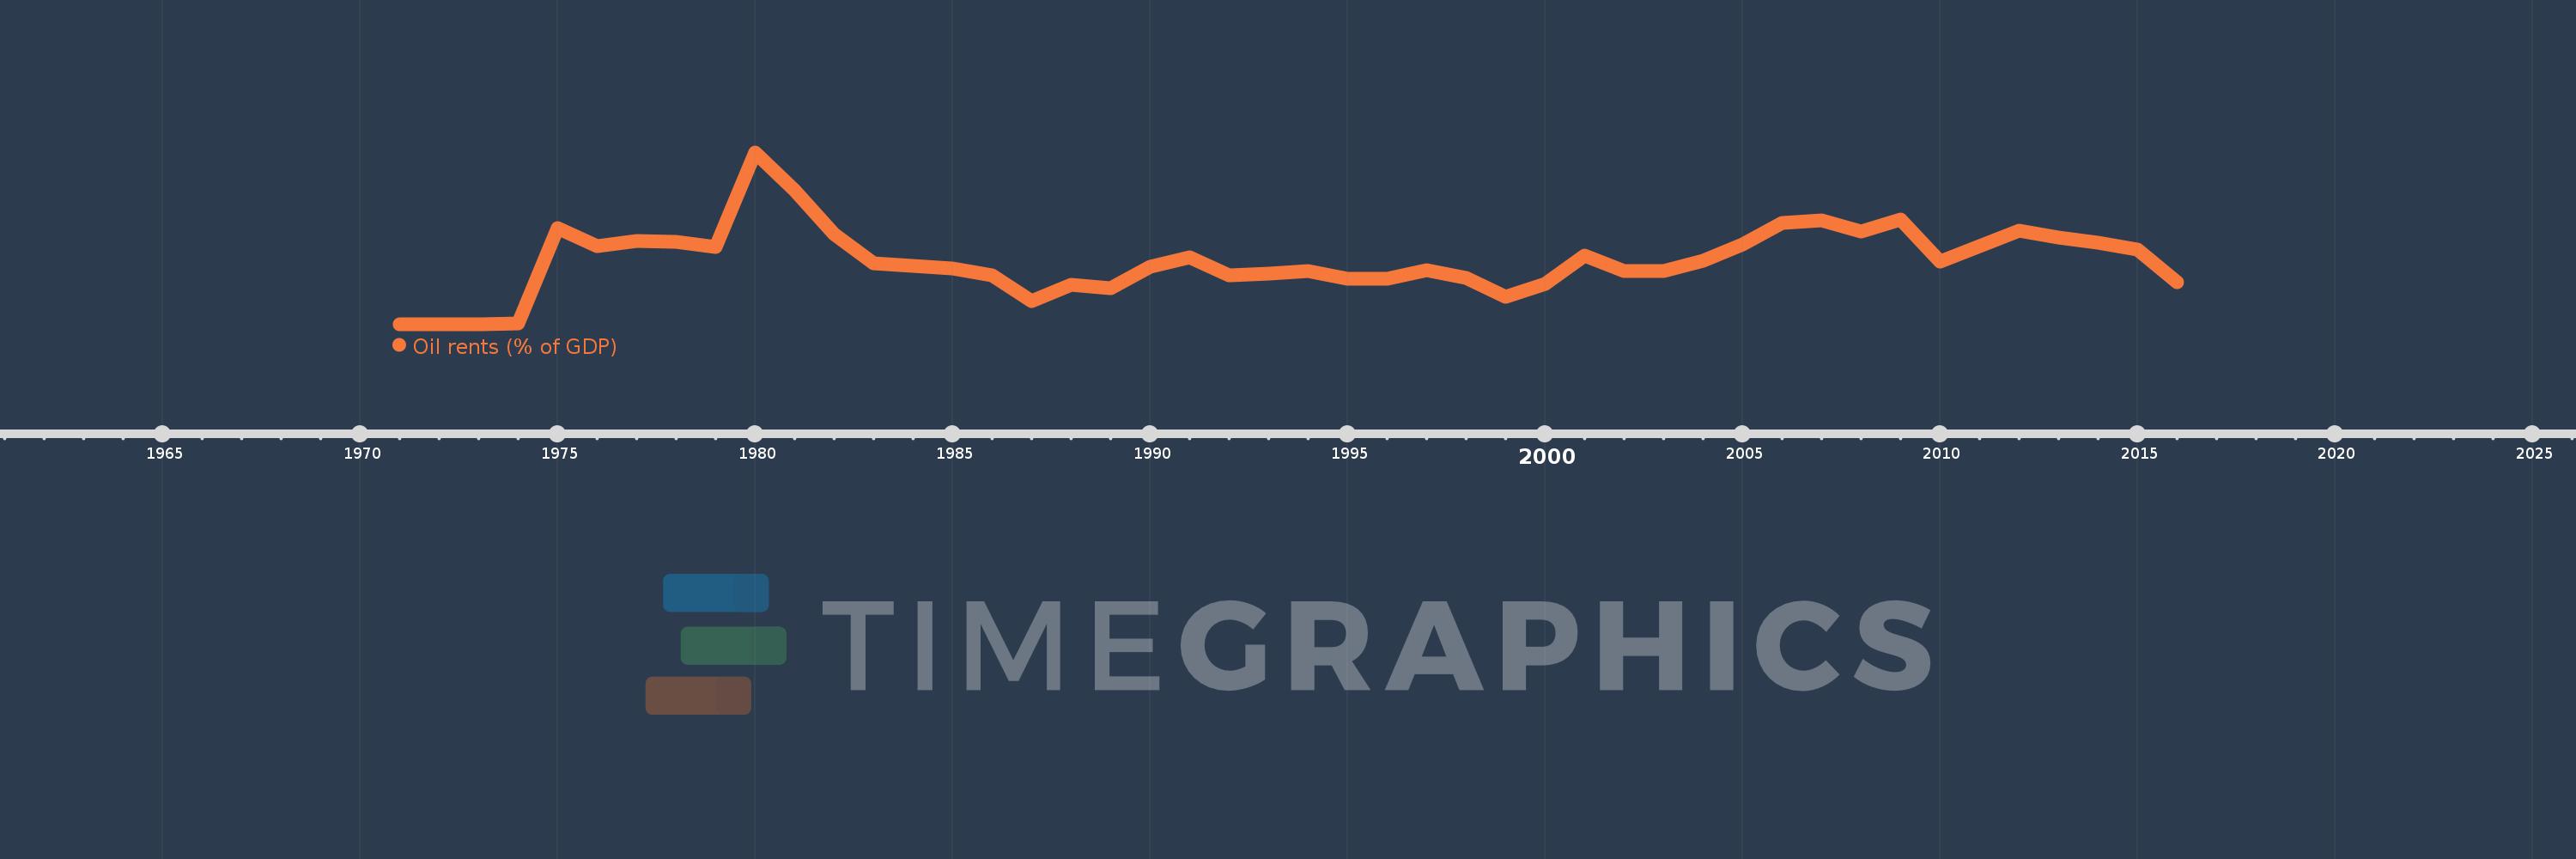
Oil rents (% of GDP)
2016,2015,2014,2013,2012,2011,2010,2009,2008,2007,2006,2005,2004,2003,2002,2001,2000,1999,1998,1997,1996,1995,1994,1993,1992,1991,1990,1989,1988,1987,1986,1985,1984,1983,1982,1981,1980,1979,1978,1977,1976,1975,1974,1973,1972,1971
This statistics in other country:
Timeline:
This timeline shows a graph from 1971 to 2016 of Middle East & North Africa. No data until 1970. Number of actual observations by date: 46.
Source name:
World Development Indicators
Source organization:
Estimates based on sources and methods described in "The Changing Wealth of Nations: Measuring Sustainable Development in the New Millennium" (World Bank, 2011).
Categories, topics:
Energy & Mining, Environment
Last updated:
apr 23, 2017
Indicators value changes by year
Maximum:
50.824
jan 1, 1980
At the date of observation
Value
Absolute change
Change from previous value
jan 1, 1971
0.063
+0.063
0.0%
jan 1, 1972
0.06
-0.003
-4.82%
jan 1, 1973
0.103
+0.043
72.54%
jan 1, 1974
0.306
+0.203
196.93%
jan 1, 1975
28.498
+28.192
9.23K%
jan 1, 1976
23.168
-5.329
-18.7%
jan 1, 1977
24.71
+1.541
6.65%
jan 1, 1978
24.325
-0.385
-1.56%
jan 1, 1979
22.833
-1.492
-6.13%
jan 1, 1980
50.824
+27.992
122.59%
jan 1, 1981
39.659
-11.165
-21.97%
jan 1, 1982
26.623
-13.036
-32.87%
jan 1, 1983
18.166
-8.457
-31.77%
jan 1, 1984
17.304
-0.862
-4.74%
jan 1, 1985
16.609
-0.695
-4.02%
jan 1, 1986
14.572
-2.037
-12.26%
jan 1, 1987
6.949
-7.623
-52.31%
jan 1, 1988
11.8
+4.85
69.8%
jan 1, 1989
10.666
-1.134
-9.61%
jan 1, 1990
17.107
+6.441
60.39%
jan 1, 1991
19.749
+2.642
15.45%
jan 1, 1992
14.59
-5.158
-26.12%
jan 1, 1993
14.956
+0.365
2.5%
jan 1, 1994
15.691
+0.735
4.92%
jan 1, 1995
13.572
-2.119
-13.5%
jan 1, 1996
13.545
-0.027
-0.2%
jan 1, 1997
15.983
+2.438
18.0%
jan 1, 1998
13.821
-2.162
-13.53%
jan 1, 1999
8.149
-5.672
-41.04%
jan 1, 2000
11.998
+3.849
47.24%
jan 1, 2001
20.448
+8.45
70.42%
jan 1, 2002
15.856
-4.592
-22.46%
jan 1, 2003
15.816
-0.04
-0.25%
jan 1, 2004
18.709
+2.894
18.3%
jan 1, 2005
23.529
+4.82
25.76%
jan 1, 2006
29.937
+6.408
27.24%
jan 1, 2007
30.745
+0.807
2.7%
jan 1, 2008
27.536
-3.209
-10.44%
jan 1, 2009
31.099
+3.563
12.94%
jan 1, 2010
18.688
-12.411
-39.91%
jan 1, 2011
23.017
+4.33
23.17%
jan 1, 2012
27.58
+4.563
19.82%
jan 1, 2013
25.638
-1.942
-7.04%
jan 1, 2014
24.059
-1.579
-6.16%
jan 1, 2015
22.122
-1.937
-8.05%
jan 1, 2016
12.541
-9.581
-43.31%
Ranking of countries by current statistics by years


Comments: