29
/
en
AIzaSyAYiBZKx7MnpbEhh9jyipgxe19OcubqV5w
April 1, 2024
276019
United Kingdom
GBR
true
2
1
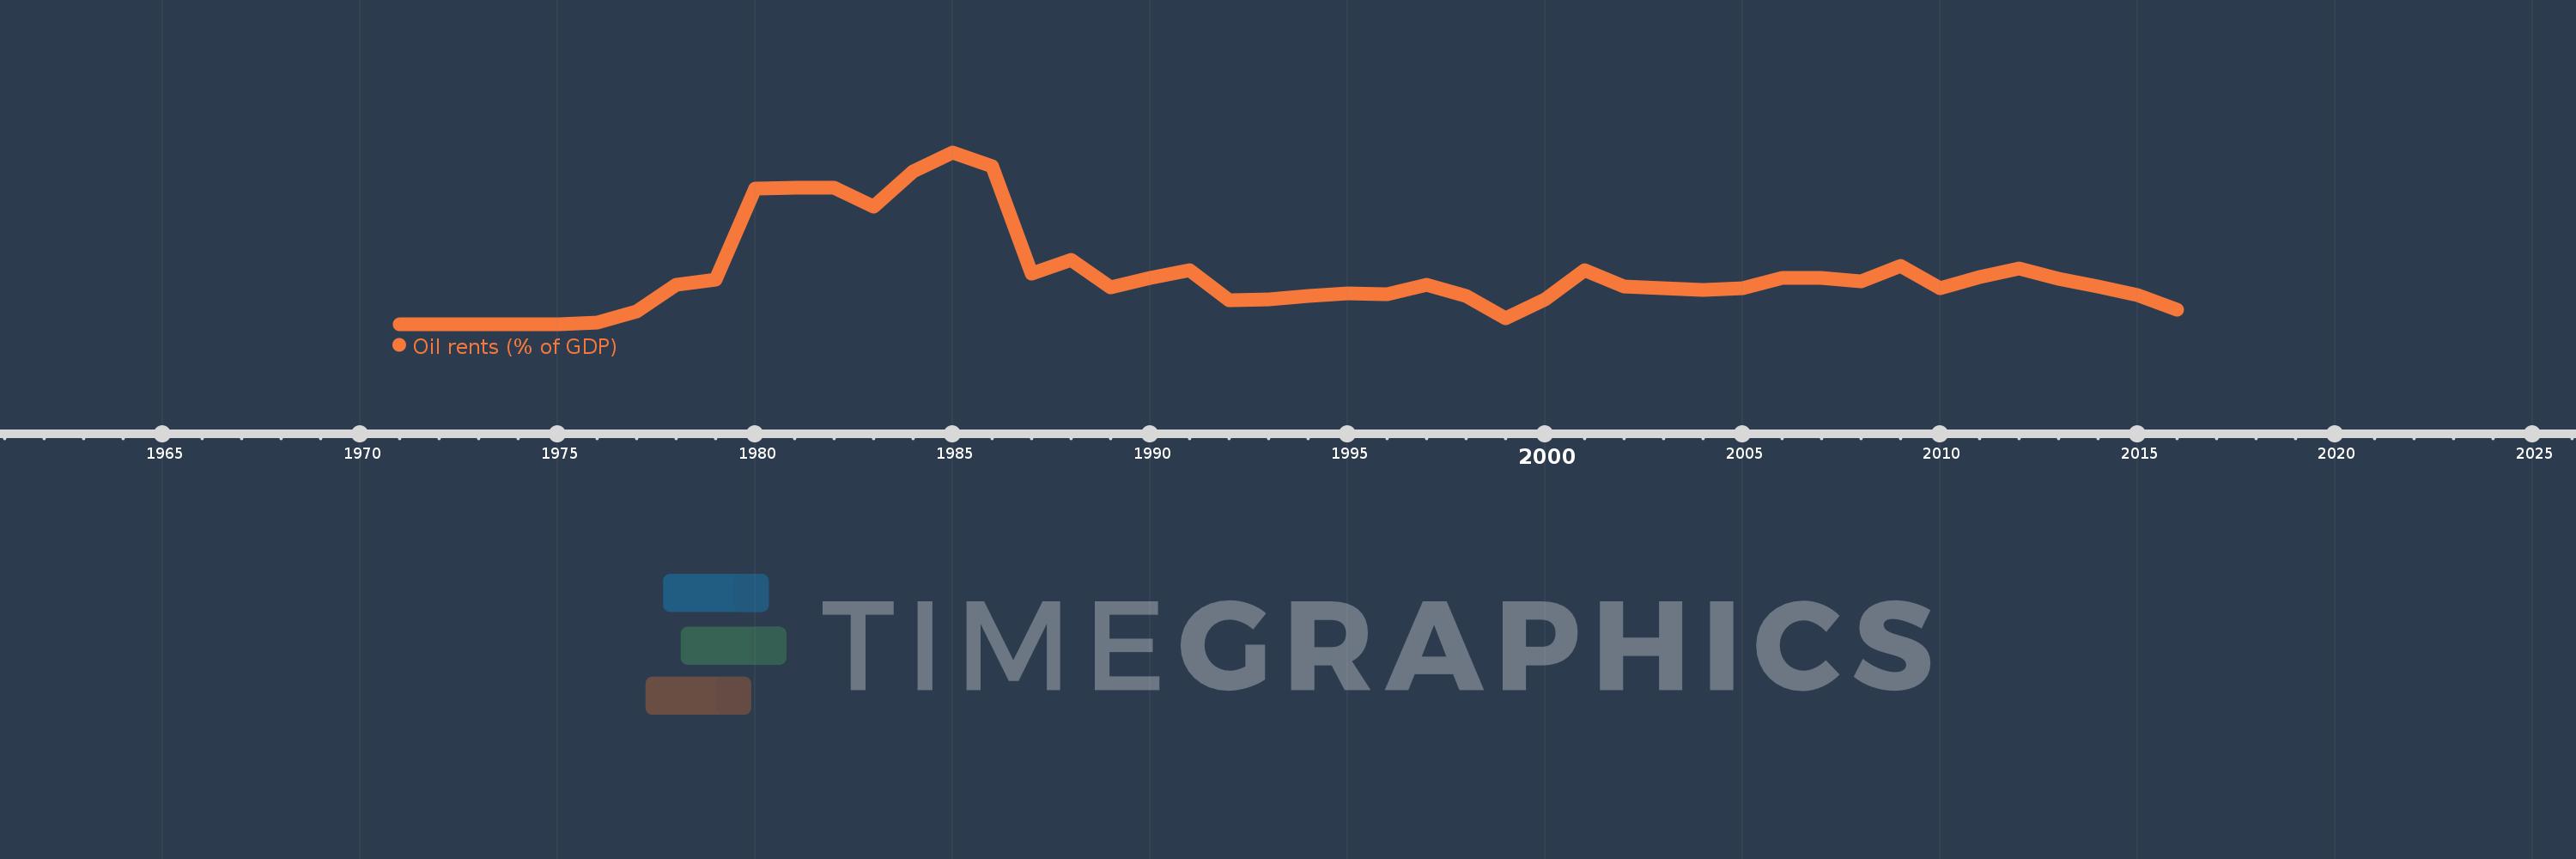
Oil rents (% of GDP)
2016,2015,2014,2013,2012,2011,2010,2009,2008,2007,2006,2005,2004,2003,2002,2001,2000,1999,1998,1997,1996,1995,1994,1993,1992,1991,1990,1989,1988,1987,1986,1985,1984,1983,1982,1981,1980,1979,1978,1977,1976,1975,1974,1973,1972,1971
This statistics in other country:
Timeline:
This timeline shows a graph from 1971 to 2016 of United Kingdom. No data until 1970. Number of actual observations by date: 46.
Source name:
World Development Indicators
Source organization:
Estimates based on sources and methods described in "The Changing Wealth of Nations: Measuring Sustainable Development in the New Millennium" (World Bank, 2011).
Categories, topics:
Energy & Mining, Environment
Last updated:
apr 23, 2017
Indicators value changes by year
At the date of observation
Value
Absolute change
Change from previous value
jan 1, 1972
0.0
0.0
-4.14%
jan 1, 1973
0.0
+0.0
110.6%
jan 1, 1974
0.0
+0.0
75.49%
jan 1, 1975
0.003
+0.003
4.48K%
jan 1, 1976
0.019
+0.016
457.44%
jan 1, 1977
0.194
+0.174
898.0%
jan 1, 1978
0.612
+0.419
216.51%
jan 1, 1979
0.701
+0.089
14.52%
jan 1, 1980
2.124
+1.423
202.83%
jan 1, 1981
2.143
+0.019
0.89%
jan 1, 1982
2.131
-0.012
-0.57%
jan 1, 1983
1.839
-0.292
-13.69%
jan 1, 1984
2.393
+0.554
30.11%
jan 1, 1985
2.689
+0.296
12.36%
jan 1, 1986
2.475
-0.214
-7.95%
jan 1, 1987
0.797
-1.678
-67.8%
jan 1, 1988
1.011
+0.214
26.81%
jan 1, 1989
0.578
-0.432
-42.76%
jan 1, 1990
0.722
+0.144
24.86%
jan 1, 1991
0.847
+0.125
17.35%
jan 1, 1992
0.374
-0.473
-55.83%
jan 1, 1993
0.387
+0.012
3.29%
jan 1, 1994
0.44
+0.053
13.73%
jan 1, 1995
0.478
+0.038
8.65%
jan 1, 1996
0.472
-0.005
-1.12%
jan 1, 1997
0.621
+0.149
31.44%
jan 1, 1998
0.438
-0.183
-29.53%
jan 1, 1999
0.091
-0.347
-79.21%
jan 1, 2000
0.388
+0.297
326.54%
jan 1, 2001
0.843
+0.455
117.38%
jan 1, 2002
0.585
-0.259
-30.68%
jan 1, 2003
0.568
-0.017
-2.86%
jan 1, 2004
0.539
-0.029
-5.15%
jan 1, 2005
0.56
+0.022
4.06%
jan 1, 2006
0.718
+0.157
28.07%
jan 1, 2007
0.721
+0.003
0.48%
jan 1, 2008
0.673
-0.049
-6.74%
jan 1, 2009
0.919
+0.246
36.63%
jan 1, 2010
0.563
-0.356
-38.75%
jan 1, 2011
0.738
+0.175
31.04%
jan 1, 2012
0.878
+0.14
19.02%
jan 1, 2013
0.714
-0.164
-18.65%
jan 1, 2014
0.587
-0.127
-17.74%
jan 1, 2015
0.457
-0.131
-22.22%
jan 1, 2016
0.224
-0.233
-50.94%
Ranking of countries by current statistics by years


Comments: