29
/
en
AIzaSyAYiBZKx7MnpbEhh9jyipgxe19OcubqV5w
April 1, 2024
61062
Sub-Saharan Africa (IDA & IBRD countries)
TSS
false
2
1
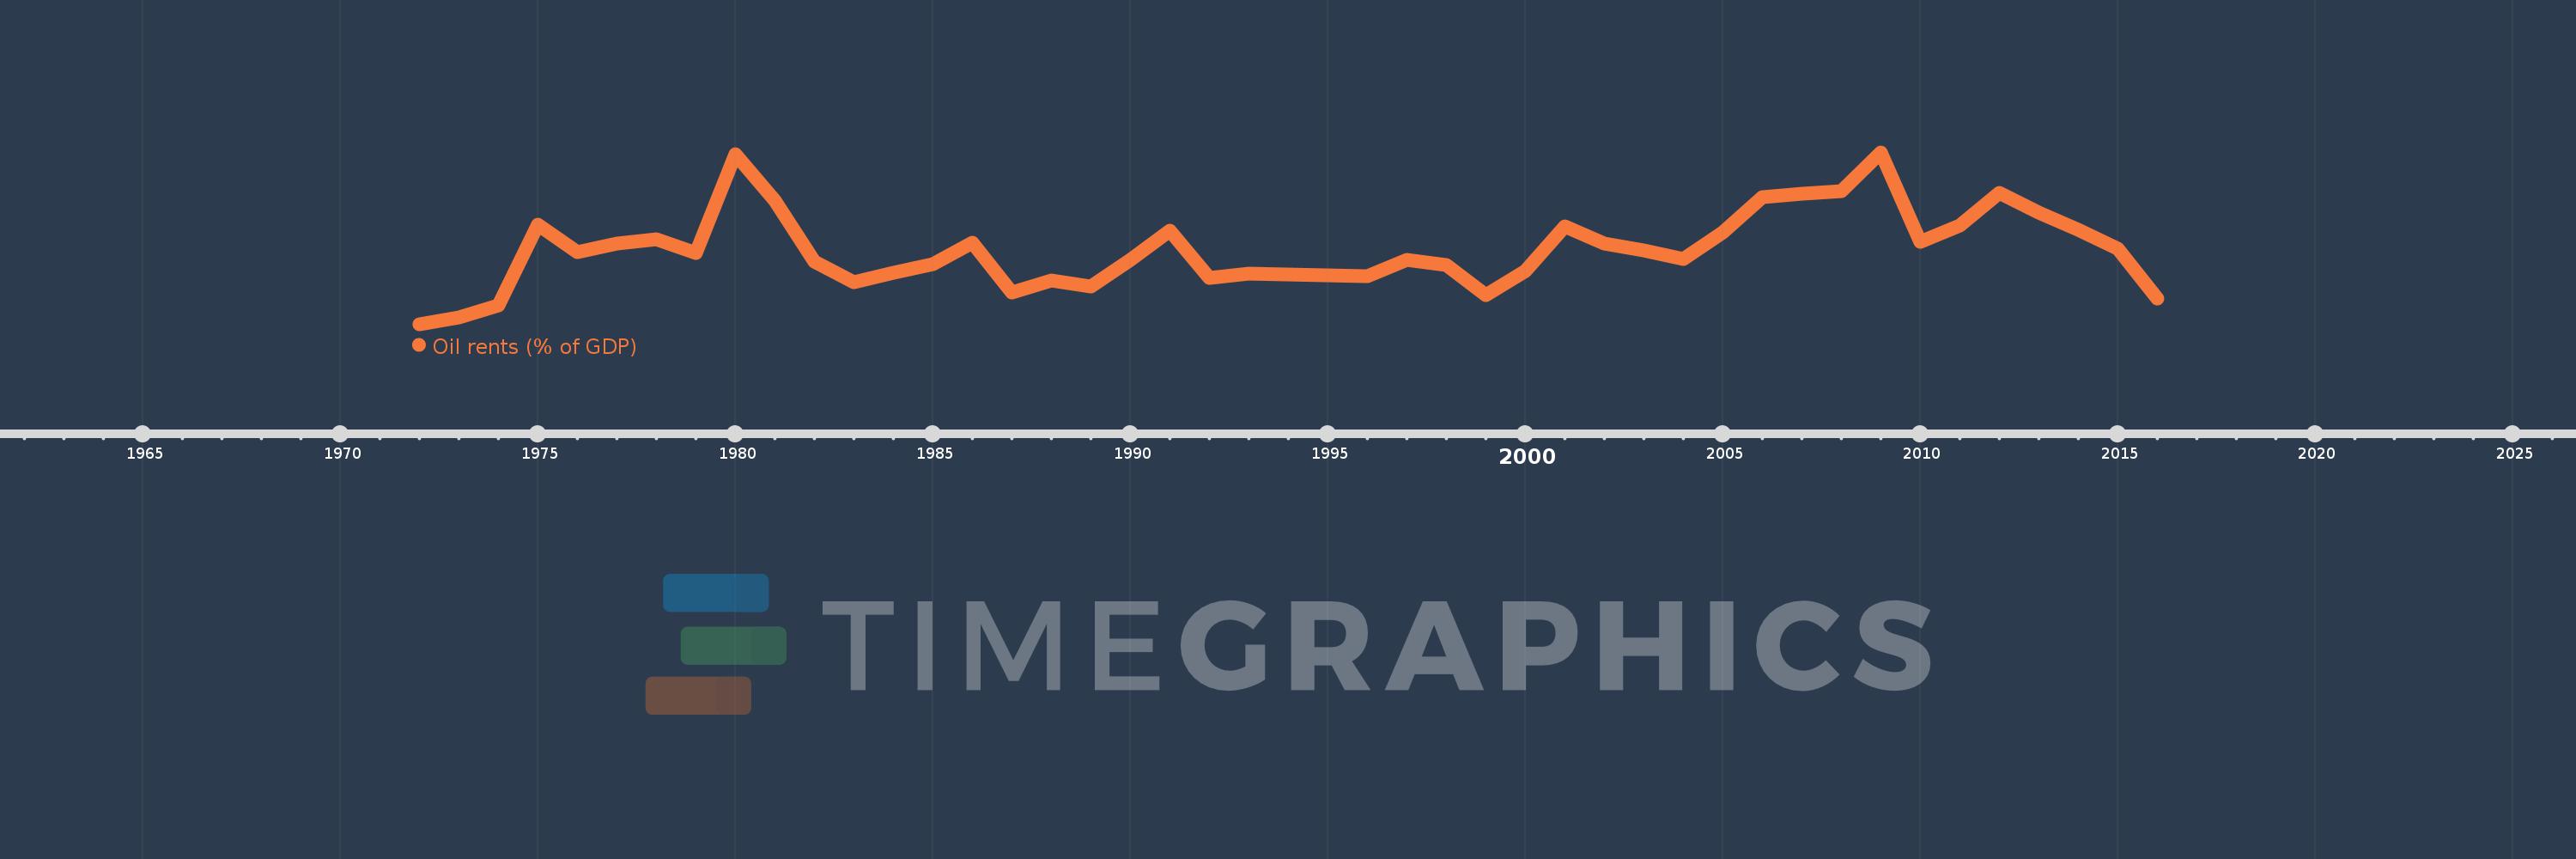
Oil rents (% of GDP)
2016,2015,2014,2013,2012,2011,2010,2009,2008,2007,2006,2005,2004,2003,2002,2001,2000,1999,1998,1997,1996,1995,1994,1993,1992,1991,1990,1989,1988,1987,1986,1985,1984,1983,1982,1981,1980,1979,1978,1977,1976,1975,1974,1973,1972
This statistics in other country:
Timeline:
This timeline shows a graph from 1972 to 2016 of Sub-Saharan Africa (IDA & IBRD countries). No data until 1971. Number of actual observations by date: 45.
Source name:
World Development Indicators
Source organization:
Estimates based on sources and methods described in "The Changing Wealth of Nations: Measuring Sustainable Development in the New Millennium" (World Bank, 2011).
Categories, topics:
Energy & Mining, Environment
Last updated:
apr 23, 2017
Indicators value changes by year
Maximum:
15.868
jan 1, 2009
At the date of observation
Value
Absolute change
Change from previous value
jan 1, 1973
0.631
+0.631
%
jan 1, 1974
1.715
+1.084
171.92%
jan 1, 1975
9.235
+7.521
438.63%
jan 1, 1976
6.657
-2.579
-27.92%
jan 1, 1977
7.462
+0.805
12.1%
jan 1, 1978
7.873
+0.411
5.5%
jan 1, 1979
6.577
-1.296
-16.46%
jan 1, 1980
15.711
+9.134
138.88%
jan 1, 1981
11.451
-4.26
-27.11%
jan 1, 1982
5.793
-5.658
-49.41%
jan 1, 1983
3.85
-1.943
-33.54%
jan 1, 1984
4.732
+0.883
22.93%
jan 1, 1985
5.563
+0.83
17.55%
jan 1, 1986
7.528
+1.965
35.33%
jan 1, 1987
2.943
-4.585
-60.91%
jan 1, 1988
4.058
+1.116
37.9%
jan 1, 1989
3.449
-0.609
-15.02%
jan 1, 1990
5.97
+2.521
73.09%
jan 1, 1991
8.613
+2.643
44.28%
jan 1, 1992
4.303
-4.31
-50.04%
jan 1, 1993
4.696
+0.393
9.14%
jan 1, 1994
4.63
-0.066
-1.41%
jan 1, 1995
4.55
-0.079
-1.71%
jan 1, 1996
4.402
-0.149
-3.27%
jan 1, 1997
5.965
+1.564
35.52%
jan 1, 1998
5.438
-0.527
-8.83%
jan 1, 1999
2.658
-2.78
-51.12%
jan 1, 2000
4.936
+2.278
85.69%
jan 1, 2001
9.063
+4.127
83.6%
jan 1, 2002
7.411
-1.652
-18.23%
jan 1, 2003
6.827
-0.585
-7.89%
jan 1, 2004
6.059
-0.768
-11.25%
jan 1, 2005
8.508
+2.449
40.43%
jan 1, 2006
11.718
+3.21
37.73%
jan 1, 2007
12.044
+0.326
2.78%
jan 1, 2008
12.262
+0.217
1.8%
jan 1, 2009
15.868
+3.607
29.41%
jan 1, 2010
7.634
-8.234
-51.89%
jan 1, 2011
9.112
+1.478
19.36%
jan 1, 2012
12.1
+2.988
32.79%
jan 1, 2013
10.286
-1.814
-14.99%
jan 1, 2014
8.75
-1.536
-14.94%
jan 1, 2015
7.008
-1.741
-19.9%
jan 1, 2016
2.397
-4.611
-65.79%
Ranking of countries by current statistics by years


Comments: