29
/
en
AIzaSyAYiBZKx7MnpbEhh9jyipgxe19OcubqV5w
April 1, 2024
111363
Congo, Rep.
COG
true
2
1
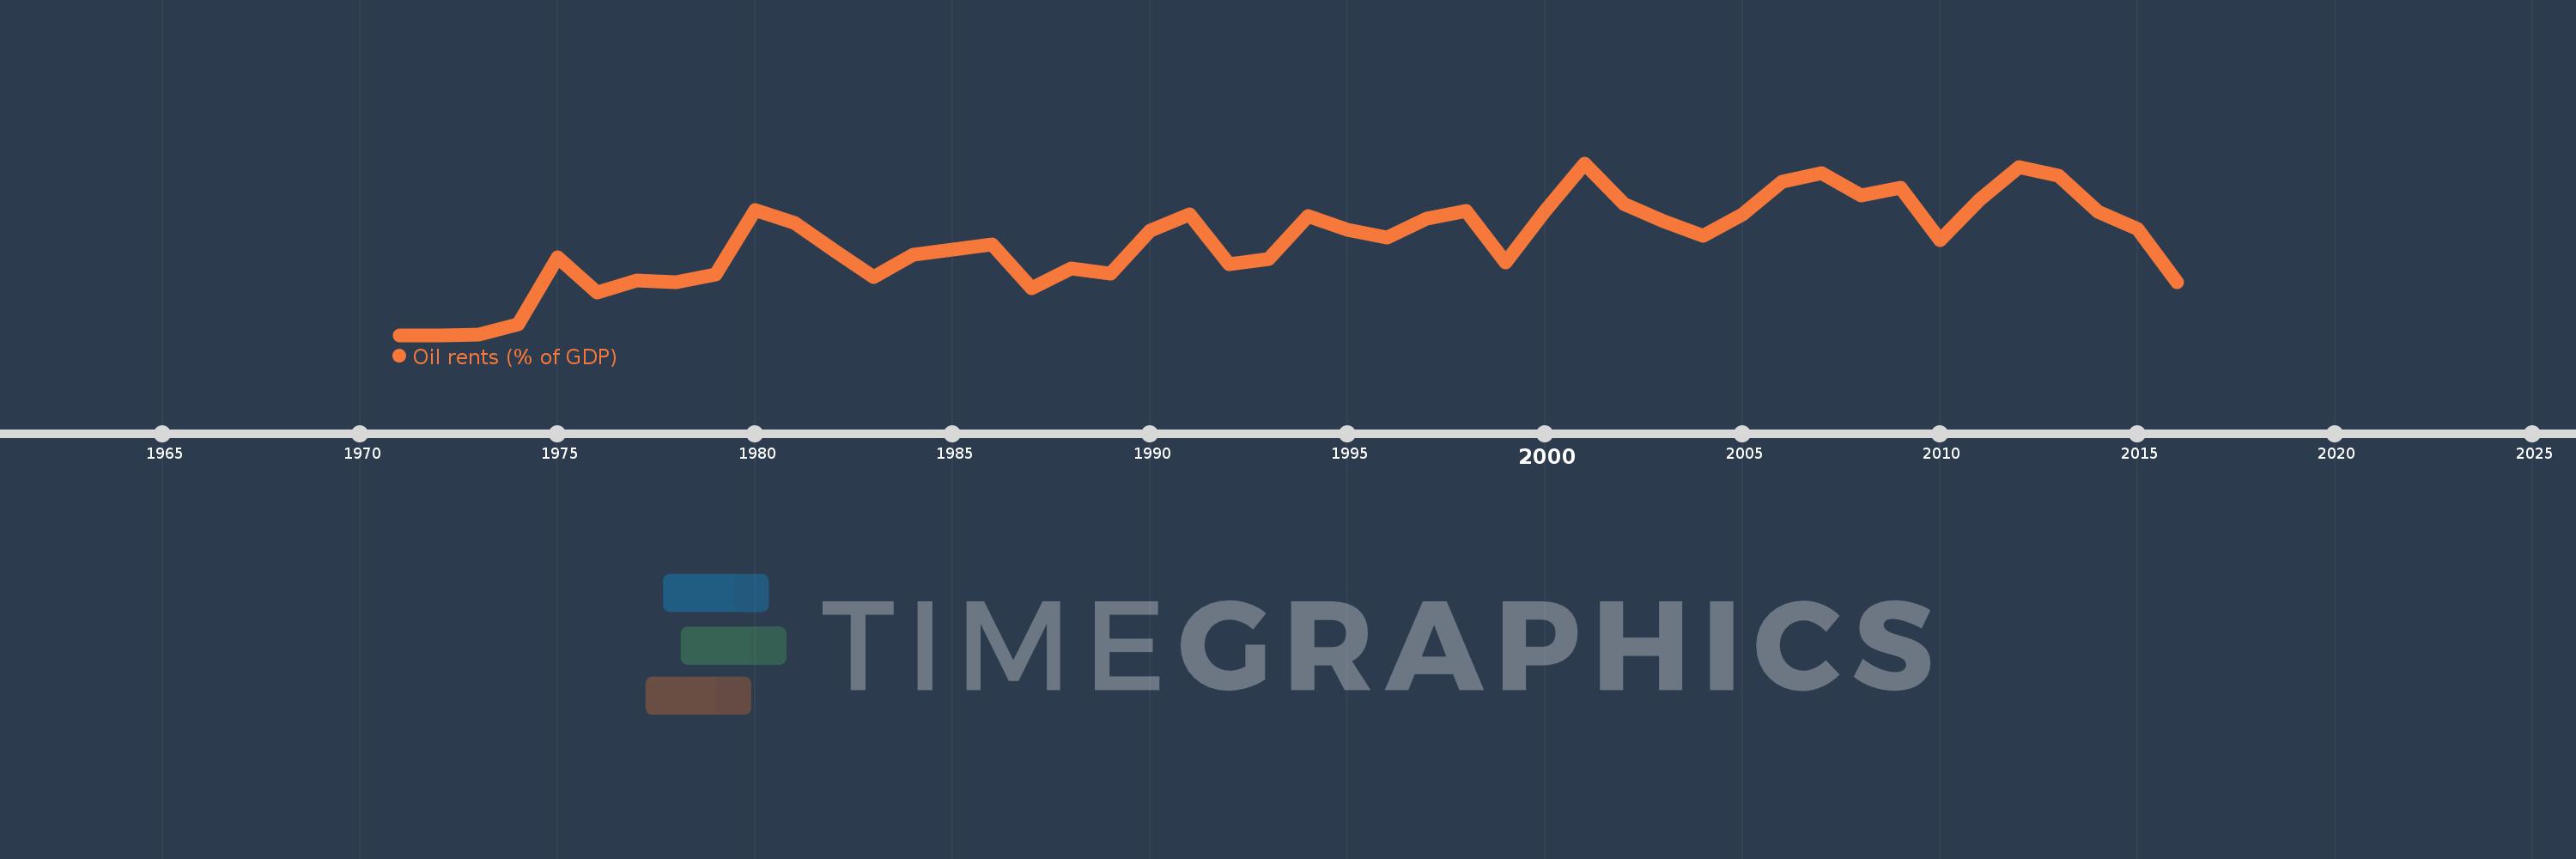
Oil rents (% of GDP)
2016,2015,2014,2013,2012,2011,2010,2009,2008,2007,2006,2005,2004,2003,2002,2001,2000,1999,1998,1997,1996,1995,1994,1993,1992,1991,1990,1989,1988,1987,1986,1985,1984,1983,1982,1981,1980,1979,1978,1977,1976,1975,1974,1973,1972,1971
This statistics in other country:
Timeline:
This timeline shows a graph from 1971 to 2016 of Congo, Rep.. No data until 1970. Number of actual observations by date: 46.
Source name:
World Development Indicators
Source organization:
Estimates based on sources and methods described in "The Changing Wealth of Nations: Measuring Sustainable Development in the New Millennium" (World Bank, 2011).
Categories, topics:
Energy & Mining, Environment
Last updated:
apr 23, 2017
Indicators value changes by year
Maximum:
58.842
jan 1, 2001
At the date of observation
Value
Absolute change
Change from previous value
jan 1, 1973
0.261
+0.261
%
jan 1, 1974
3.694
+3.432
1.31K%
jan 1, 1975
26.616
+22.923
620.59%
jan 1, 1976
14.543
-12.073
-45.36%
jan 1, 1977
18.651
+4.108
28.25%
jan 1, 1978
18.223
-0.428
-2.3%
jan 1, 1979
20.862
+2.639
14.48%
jan 1, 1980
42.833
+21.971
105.32%
jan 1, 1981
38.54
-4.293
-10.02%
jan 1, 1982
29.099
-9.441
-24.5%
jan 1, 1983
19.838
-9.261
-31.82%
jan 1, 1984
27.603
+7.764
39.14%
jan 1, 1985
29.322
+1.719
6.23%
jan 1, 1986
31.086
+1.764
6.02%
jan 1, 1987
15.935
-15.151
-48.74%
jan 1, 1988
22.799
+6.864
43.08%
jan 1, 1989
21.088
-1.711
-7.51%
jan 1, 1990
35.711
+14.623
69.35%
jan 1, 1991
41.35
+5.638
15.79%
jan 1, 1992
24.291
-17.059
-41.26%
jan 1, 1993
26.084
+1.794
7.38%
jan 1, 1994
40.821
+14.736
56.49%
jan 1, 1995
36.149
-4.672
-11.44%
jan 1, 1996
33.246
-2.902
-8.03%
jan 1, 1997
39.838
+6.592
19.83%
jan 1, 1998
42.491
+2.652
6.66%
jan 1, 1999
24.985
-17.506
-41.2%
jan 1, 2000
42.385
+17.4
69.64%
jan 1, 2001
58.842
+16.457
38.83%
jan 1, 2002
44.895
-13.947
-23.7%
jan 1, 2003
39.045
-5.85
-13.03%
jan 1, 2004
34.026
-5.019
-12.85%
jan 1, 2005
41.326
+7.3
21.45%
jan 1, 2006
52.624
+11.298
27.34%
jan 1, 2007
55.583
+2.958
5.62%
jan 1, 2008
47.681
-7.901
-14.22%
jan 1, 2009
50.445
+2.764
5.8%
jan 1, 2010
32.386
-18.059
-35.8%
jan 1, 2011
46.359
+13.973
43.14%
jan 1, 2012
57.423
+11.065
23.87%
jan 1, 2013
54.529
-2.895
-5.04%
jan 1, 2014
42.188
-12.34
-22.63%
jan 1, 2015
36.214
-5.974
-14.16%
jan 1, 2016
18.172
-18.042
-49.82%
Ranking of countries by current statistics by years


Comments: