29
/
en
AIzaSyAYiBZKx7MnpbEhh9jyipgxe19OcubqV5w
April 1, 2024
45434
Low & middle income
LMY
false
2
1
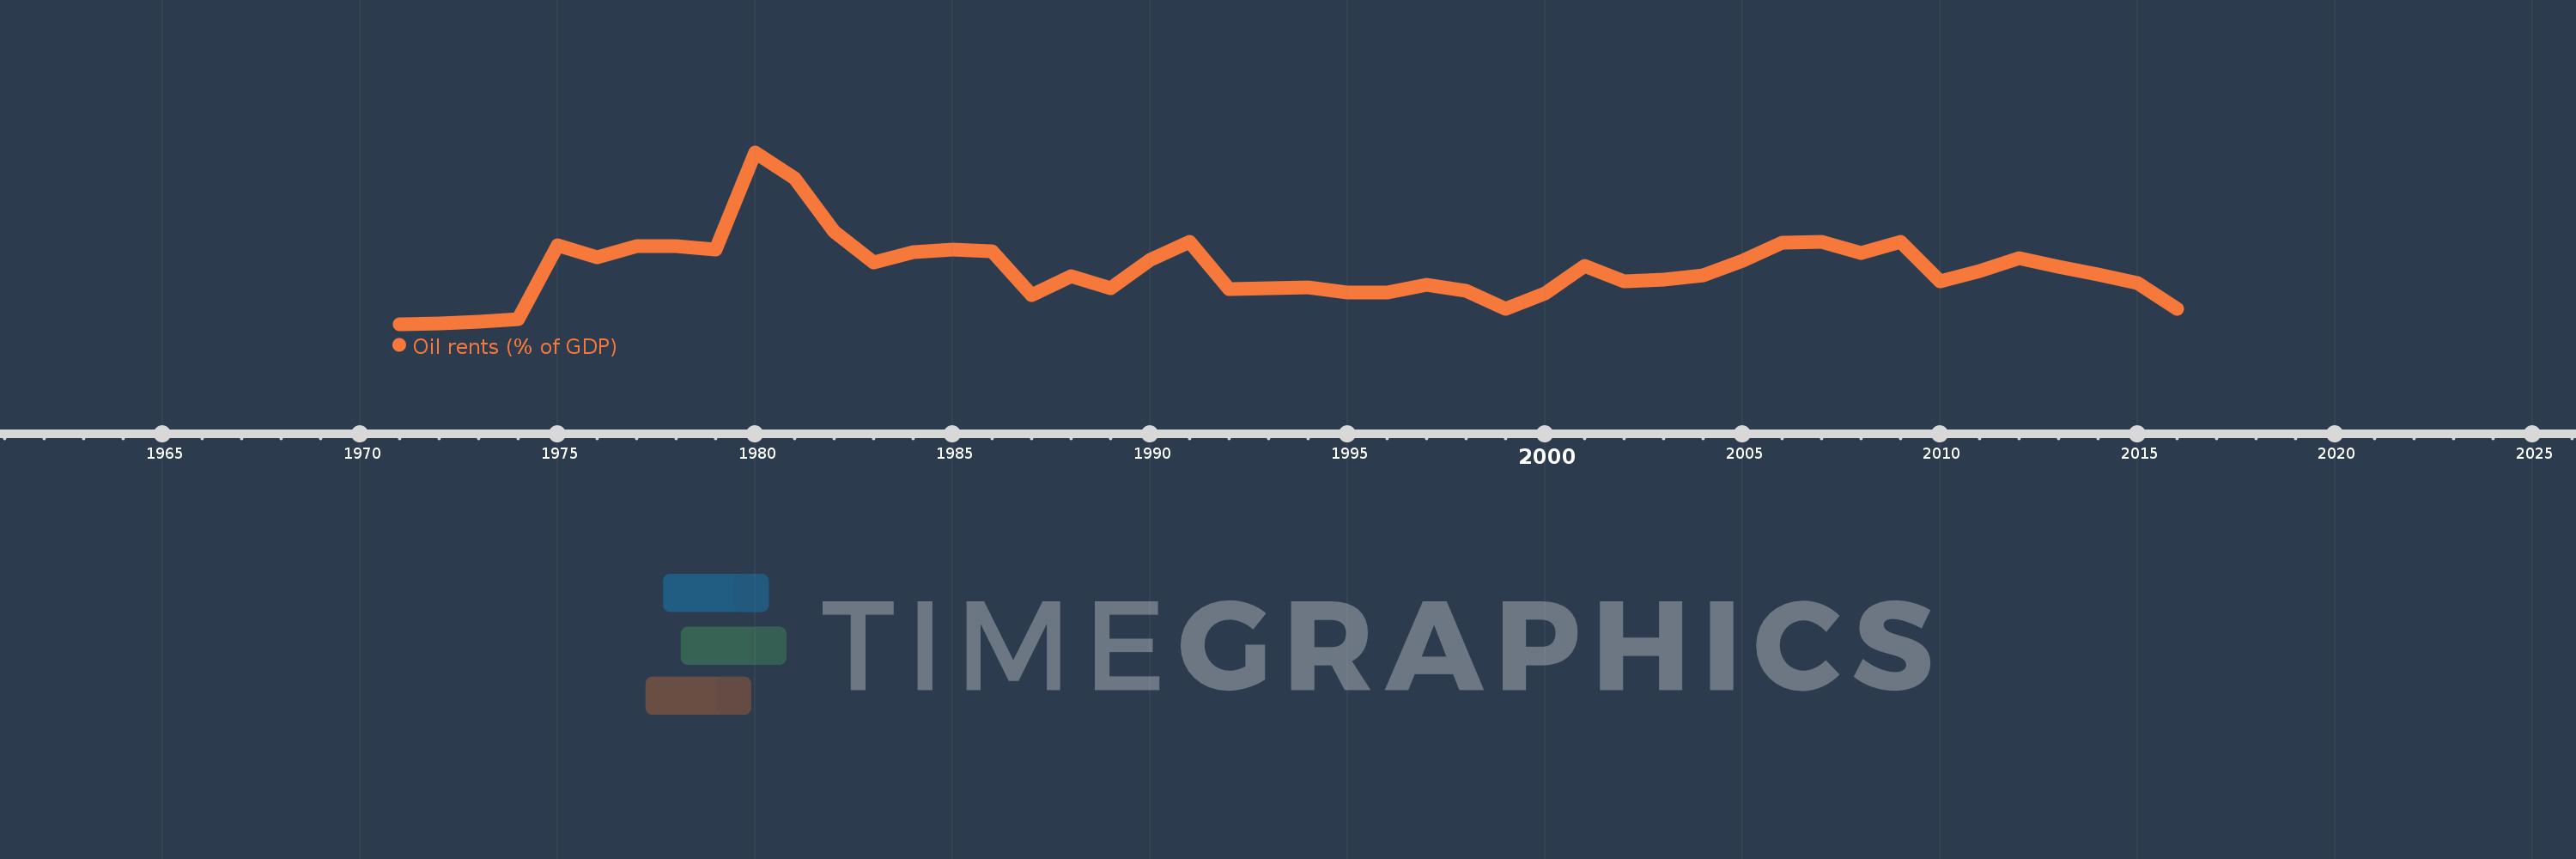
Oil rents (% of GDP)
2016,2015,2014,2013,2012,2011,2010,2009,2008,2007,2006,2005,2004,2003,2002,2001,2000,1999,1998,1997,1996,1995,1994,1993,1992,1991,1990,1989,1988,1987,1986,1985,1984,1983,1982,1981,1980,1979,1978,1977,1976,1975,1974,1973,1972,1971
This statistics in other country:
Timeline:
This timeline shows a graph from 1971 to 2016 of Low & middle income. No data until 1970. Number of actual observations by date: 46.
Source name:
World Development Indicators
Source organization:
Estimates based on sources and methods described in "The Changing Wealth of Nations: Measuring Sustainable Development in the New Millennium" (World Bank, 2011).
Categories, topics:
Energy & Mining, Environment
Last updated:
apr 23, 2017
Indicators value changes by year
Maximum:
12.887
jan 1, 1980
At the date of observation
Value
Absolute change
Change from previous value
jan 1, 1971
0.013
+0.013
0.0%
jan 1, 1972
0.056
+0.043
326.1%
jan 1, 1973
0.174
+0.118
210.11%
jan 1, 1974
0.412
+0.238
137.1%
jan 1, 1975
5.926
+5.514
1.34K%
jan 1, 1976
5.014
-0.912
-15.39%
jan 1, 1977
5.854
+0.84
16.76%
jan 1, 1978
5.895
+0.041
0.7%
jan 1, 1979
5.634
-0.261
-4.42%
jan 1, 1980
12.887
+7.253
128.73%
jan 1, 1981
10.921
-1.966
-15.26%
jan 1, 1982
6.935
-3.987
-36.5%
jan 1, 1983
4.623
-2.311
-33.33%
jan 1, 1984
5.427
+0.804
17.38%
jan 1, 1985
5.599
+0.172
3.17%
jan 1, 1986
5.465
-0.134
-2.4%
jan 1, 1987
2.187
-3.278
-59.98%
jan 1, 1988
3.635
+1.448
66.22%
jan 1, 1989
2.709
-0.926
-25.48%
jan 1, 1990
4.811
+2.101
77.57%
jan 1, 1991
6.157
+1.347
28.0%
jan 1, 1992
2.654
-3.503
-56.89%
jan 1, 1993
2.691
+0.037
1.38%
jan 1, 1994
2.788
+0.097
3.62%
jan 1, 1995
2.359
-0.429
-15.38%
jan 1, 1996
2.416
+0.057
2.41%
jan 1, 1997
2.978
+0.561
23.23%
jan 1, 1998
2.49
-0.487
-16.37%
jan 1, 1999
1.181
-1.309
-52.57%
jan 1, 2000
2.338
+1.157
97.97%
jan 1, 2001
4.354
+2.015
86.18%
jan 1, 2002
3.233
-1.12
-25.74%
jan 1, 2003
3.347
+0.114
3.52%
jan 1, 2004
3.679
+0.332
9.93%
jan 1, 2005
4.748
+1.068
29.04%
jan 1, 2006
6.144
+1.397
29.42%
jan 1, 2007
6.211
+0.067
1.09%
jan 1, 2008
5.373
-0.838
-13.49%
jan 1, 2009
6.175
+0.802
14.93%
jan 1, 2010
3.222
-2.953
-47.82%
jan 1, 2011
3.983
+0.76
23.6%
jan 1, 2012
4.947
+0.964
24.21%
jan 1, 2013
4.308
-0.639
-12.91%
jan 1, 2014
3.755
-0.553
-12.84%
jan 1, 2015
3.113
-0.642
-17.09%
jan 1, 2016
1.172
-1.942
-62.36%
Ranking of countries by current statistics by years


Comments: