29
/
en
AIzaSyAYiBZKx7MnpbEhh9jyipgxe19OcubqV5w
April 1, 2024
30169
Euro area
EMU
false
2
1
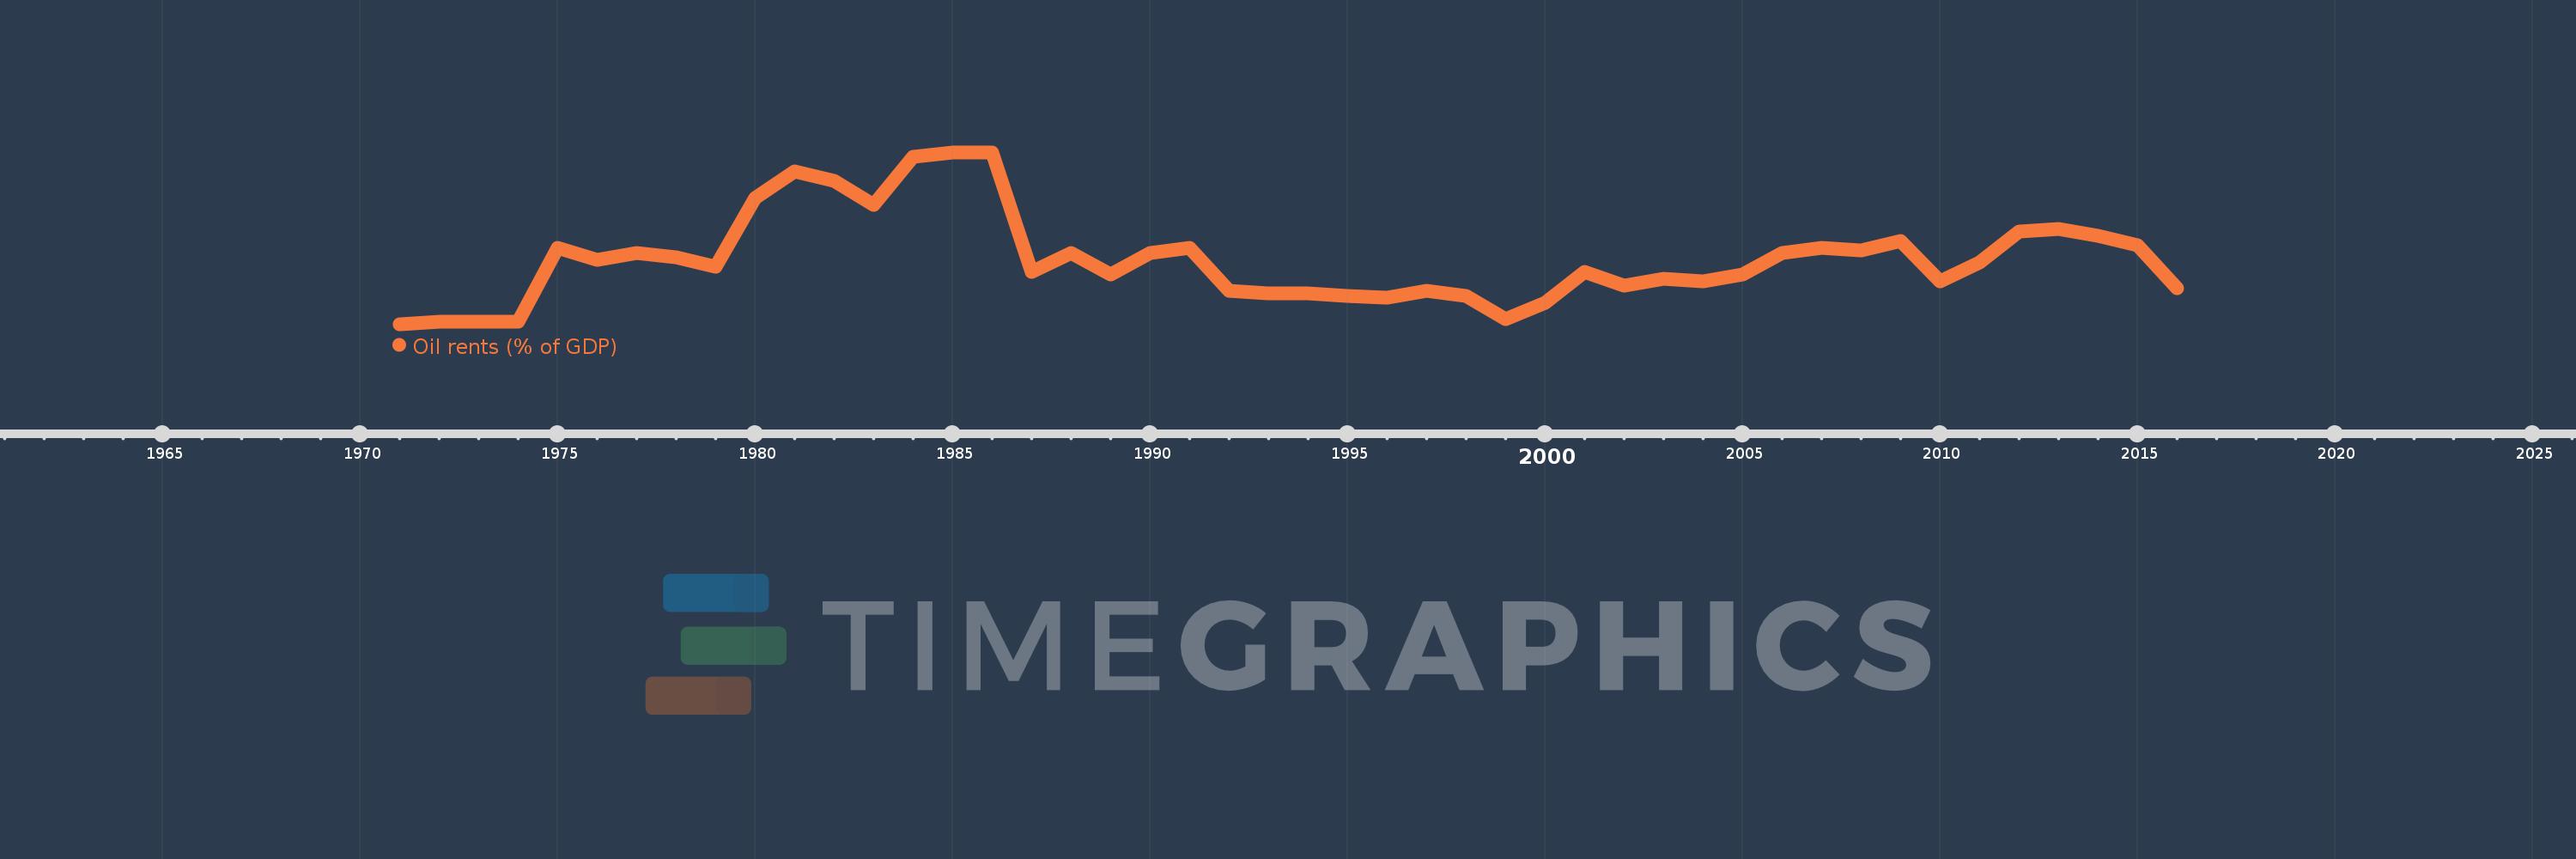
Oil rents (% of GDP)
2016,2015,2014,2013,2012,2011,2010,2009,2008,2007,2006,2005,2004,2003,2002,2001,2000,1999,1998,1997,1996,1995,1994,1993,1992,1991,1990,1989,1988,1987,1986,1985,1984,1983,1982,1981,1980,1979,1978,1977,1976,1975,1974,1973,1972,1971
This statistics in other country:
Timeline:
This timeline shows a graph from 1971 to 2016 of Euro area. No data until 1970. Number of actual observations by date: 46.
Source name:
World Development Indicators
Source organization:
Estimates based on sources and methods described in "The Changing Wealth of Nations: Measuring Sustainable Development in the New Millennium" (World Bank, 2011).
Categories, topics:
Energy & Mining, Environment
Last updated:
apr 23, 2017
Indicators value changes by year
At the date of observation
Value
Absolute change
Change from previous value
jan 1, 1972
0.001
+0.0
34.91%
jan 1, 1973
0.001
0.0
-5.45%
jan 1, 1974
0.001
+0.0
19.34%
jan 1, 1975
0.032
+0.032
4.24K%
jan 1, 1976
0.027
-0.006
-17.39%
jan 1, 1977
0.03
+0.003
11.97%
jan 1, 1978
0.028
-0.002
-7.04%
jan 1, 1979
0.024
-0.004
-14.71%
jan 1, 1980
0.053
+0.03
124.61%
jan 1, 1981
0.064
+0.01
19.22%
jan 1, 1982
0.06
-0.004
-6.13%
jan 1, 1983
0.05
-0.01
-16.02%
jan 1, 1984
0.07
+0.02
39.94%
jan 1, 1985
0.072
+0.002
2.14%
jan 1, 1986
0.072
+0.001
0.95%
jan 1, 1987
0.022
-0.051
-69.9%
jan 1, 1988
0.03
+0.008
35.64%
jan 1, 1989
0.021
-0.009
-29.2%
jan 1, 1990
0.03
+0.009
42.8%
jan 1, 1991
0.032
+0.002
5.88%
jan 1, 1992
0.014
-0.018
-56.16%
jan 1, 1993
0.013
-0.001
-9.88%
jan 1, 1994
0.013
+0.0
1.35%
jan 1, 1995
0.012
-0.001
-8.37%
jan 1, 1996
0.011
-0.001
-7.28%
jan 1, 1997
0.014
+0.003
29.42%
jan 1, 1998
0.012
-0.002
-15.62%
jan 1, 1999
0.002
-0.009
-79.96%
jan 1, 2000
0.009
+0.006
270.16%
jan 1, 2001
0.022
+0.014
156.66%
jan 1, 2002
0.016
-0.006
-28.51%
jan 1, 2003
0.019
+0.003
17.77%
jan 1, 2004
0.018
0.0
-2.08%
jan 1, 2005
0.021
+0.002
12.96%
jan 1, 2006
0.03
+0.009
44.21%
jan 1, 2007
0.032
+0.002
6.71%
jan 1, 2008
0.031
-0.001
-3.49%
jan 1, 2009
0.035
+0.004
13.31%
jan 1, 2010
0.018
-0.017
-49.55%
jan 1, 2011
0.026
+0.009
48.75%
jan 1, 2012
0.039
+0.012
46.27%
jan 1, 2013
0.04
+0.001
3.25%
jan 1, 2014
0.037
-0.003
-8.08%
jan 1, 2015
0.033
-0.004
-10.95%
jan 1, 2016
0.015
-0.018
-54.34%
Ranking of countries by current statistics by years


Comments: