29
/
en
AIzaSyAYiBZKx7MnpbEhh9jyipgxe19OcubqV5w
April 1, 2024
242974
Slovenia
SVN
true
2
1
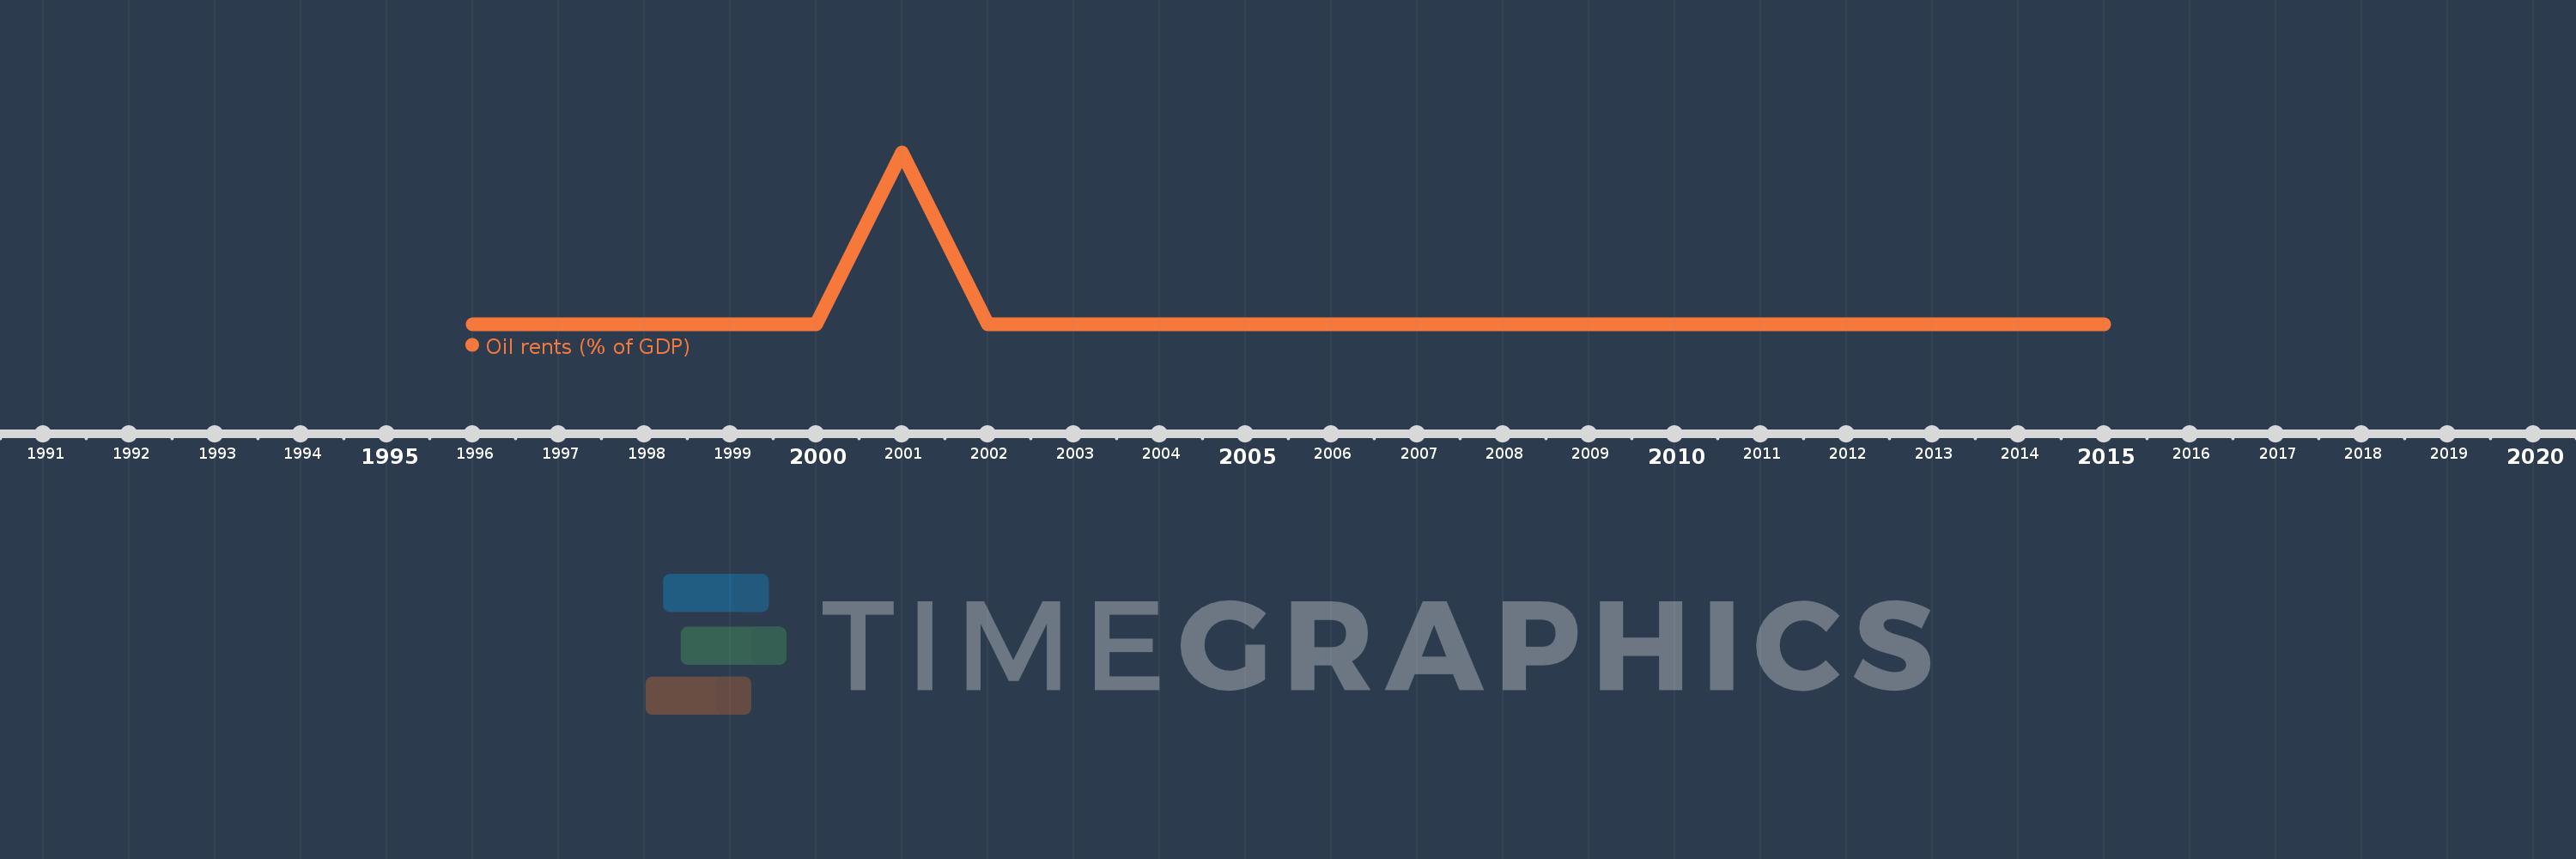
Oil rents (% of GDP)
2015,2014,2013,2012,2011,2010,2009,2008,2007,2006,2005,2004,2003,2002,2001,2000,1999,1998,1997,1996
This statistics in other country:
Timeline:
This timeline shows a graph from 1996 to 2015 of Slovenia. No data until 1995. Number of actual observations by date: 20.
Source name:
World Development Indicators
Source organization:
Estimates based on sources and methods described in "The Changing Wealth of Nations: Measuring Sustainable Development in the New Millennium" (World Bank, 2011).
Categories, topics:
Energy & Mining, Environment
Last updated:
apr 23, 2017
Indicators value changes by year
At the date of observation
Value
Absolute change
Change from previous value
jan 1, 1997
0.0
0.0
-31.22%
jan 1, 1998
0.0
+0.0
5.75%
jan 1, 1999
0.0
0.0
-84.66%
jan 1, 2000
0.0
+0.0
309.92%
jan 1, 2001
0.001
+0.0
161.87%
jan 1, 2002
0.0
0.0
-49.42%
jan 1, 2004
0.0
0.0
-31.87%
jan 1, 2005
0.0
0.0
-28.98%
jan 1, 2006
0.0
+0.0
20.16%
jan 1, 2007
0.0
+0.0
9.14%
jan 1, 2008
0.0
0.0
-13.11%
jan 1, 2009
0.0
+0.0
19.58%
jan 1, 2010
0.0
0.0
-42.0%
jan 1, 2011
0.0
+0.0
52.32%
jan 1, 2012
0.0
+0.0
43.0%
jan 1, 2013
0.0
+0.0
5.94%
jan 1, 2014
0.0
0.0
-10.56%
jan 1, 2015
0.0
0.0
-15.26%
Ranking of countries by current statistics by years


Comments: