29
/
en
AIzaSyAYiBZKx7MnpbEhh9jyipgxe19OcubqV5w
April 1, 2024
262703
Thailand
THA
true
2
1
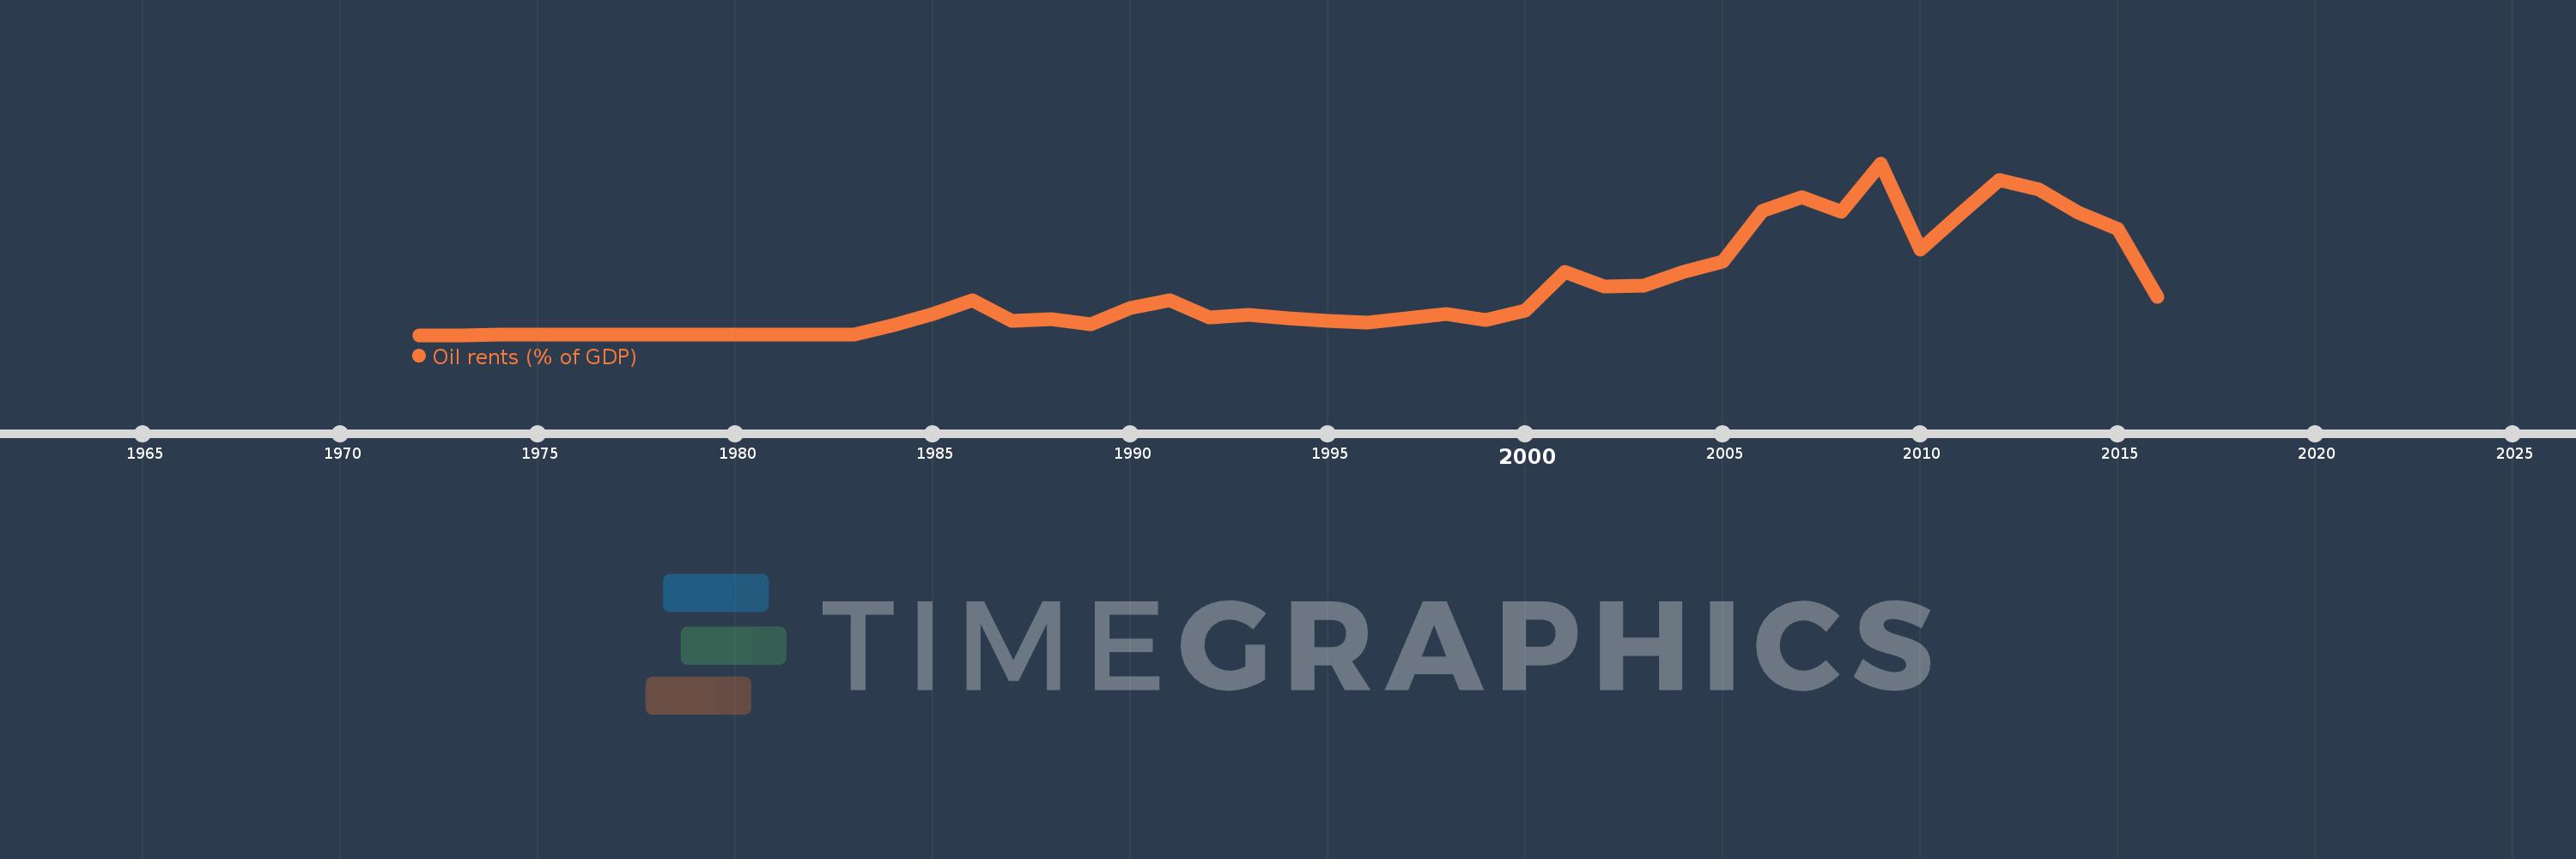
Oil rents (% of GDP)
2016,2015,2014,2013,2012,2011,2010,2009,2008,2007,2006,2005,2004,2003,2002,2001,2000,1999,1998,1997,1996,1995,1994,1993,1992,1991,1990,1989,1988,1987,1986,1985,1984,1983,1982,1981,1980,1979,1978,1977,1976,1975,1974,1973,1972
This statistics in other country:
Timeline:
This timeline shows a graph from 1972 to 2016 of Thailand. No data until 1971. Number of actual observations by date: 45.
Source name:
World Development Indicators
Source organization:
Estimates based on sources and methods described in "The Changing Wealth of Nations: Measuring Sustainable Development in the New Millennium" (World Bank, 2011).
Categories, topics:
Energy & Mining, Environment
Last updated:
apr 23, 2017
Indicators value changes by year
At the date of observation
Value
Absolute change
Change from previous value
jan 1, 1973
0.0
0.0
-12.67%
jan 1, 1974
0.001
+0.0
67.87%
jan 1, 1975
0.003
+0.002
349.09%
jan 1, 1976
0.002
0.0
-6.85%
jan 1, 1977
0.003
+0.001
27.32%
jan 1, 1978
0.004
+0.001
45.4%
jan 1, 1979
0.003
-0.001
-22.47%
jan 1, 1980
0.008
+0.005
143.39%
jan 1, 1981
0.009
+0.001
11.87%
jan 1, 1982
0.008
-0.002
-16.72%
jan 1, 1983
0.004
-0.003
-44.66%
jan 1, 1984
0.101
+0.097
2.3K%
jan 1, 1985
0.227
+0.126
124.12%
jan 1, 1986
0.368
+0.141
62.08%
jan 1, 1987
0.152
-0.216
-58.62%
jan 1, 1988
0.166
+0.014
9.35%
jan 1, 1989
0.116
-0.05
-30.34%
jan 1, 1990
0.287
+0.171
147.93%
jan 1, 1991
0.372
+0.084
29.37%
jan 1, 1992
0.19
-0.182
-48.82%
jan 1, 1993
0.212
+0.021
11.21%
jan 1, 1994
0.179
-0.032
-15.33%
jan 1, 1995
0.15
-0.029
-16.06%
jan 1, 1996
0.135
-0.016
-10.38%
jan 1, 1997
0.179
+0.044
32.62%
jan 1, 1998
0.224
+0.045
25.24%
jan 1, 1999
0.159
-0.065
-28.94%
jan 1, 2000
0.262
+0.103
64.86%
jan 1, 2001
0.675
+0.413
157.42%
jan 1, 2002
0.52
-0.155
-22.98%
jan 1, 2003
0.529
+0.009
1.71%
jan 1, 2004
0.67
+0.141
26.6%
jan 1, 2005
0.786
+0.117
17.46%
jan 1, 2006
1.322
+0.535
68.07%
jan 1, 2007
1.467
+0.145
10.97%
jan 1, 2008
1.316
-0.151
-10.3%
jan 1, 2009
1.83
+0.514
39.09%
jan 1, 2010
0.911
-0.919
-50.2%
jan 1, 2011
1.282
+0.371
40.66%
jan 1, 2012
1.65
+0.368
28.73%
jan 1, 2013
1.555
-0.095
-5.77%
jan 1, 2014
1.308
-0.246
-15.84%
jan 1, 2015
1.128
-0.181
-13.82%
jan 1, 2016
0.409
-0.719
-63.73%
Ranking of countries by current statistics by years


Comments: