29
/
en
AIzaSyAYiBZKx7MnpbEhh9jyipgxe19OcubqV5w
April 1, 2024
152912
Hungary
HUN
true
2
1
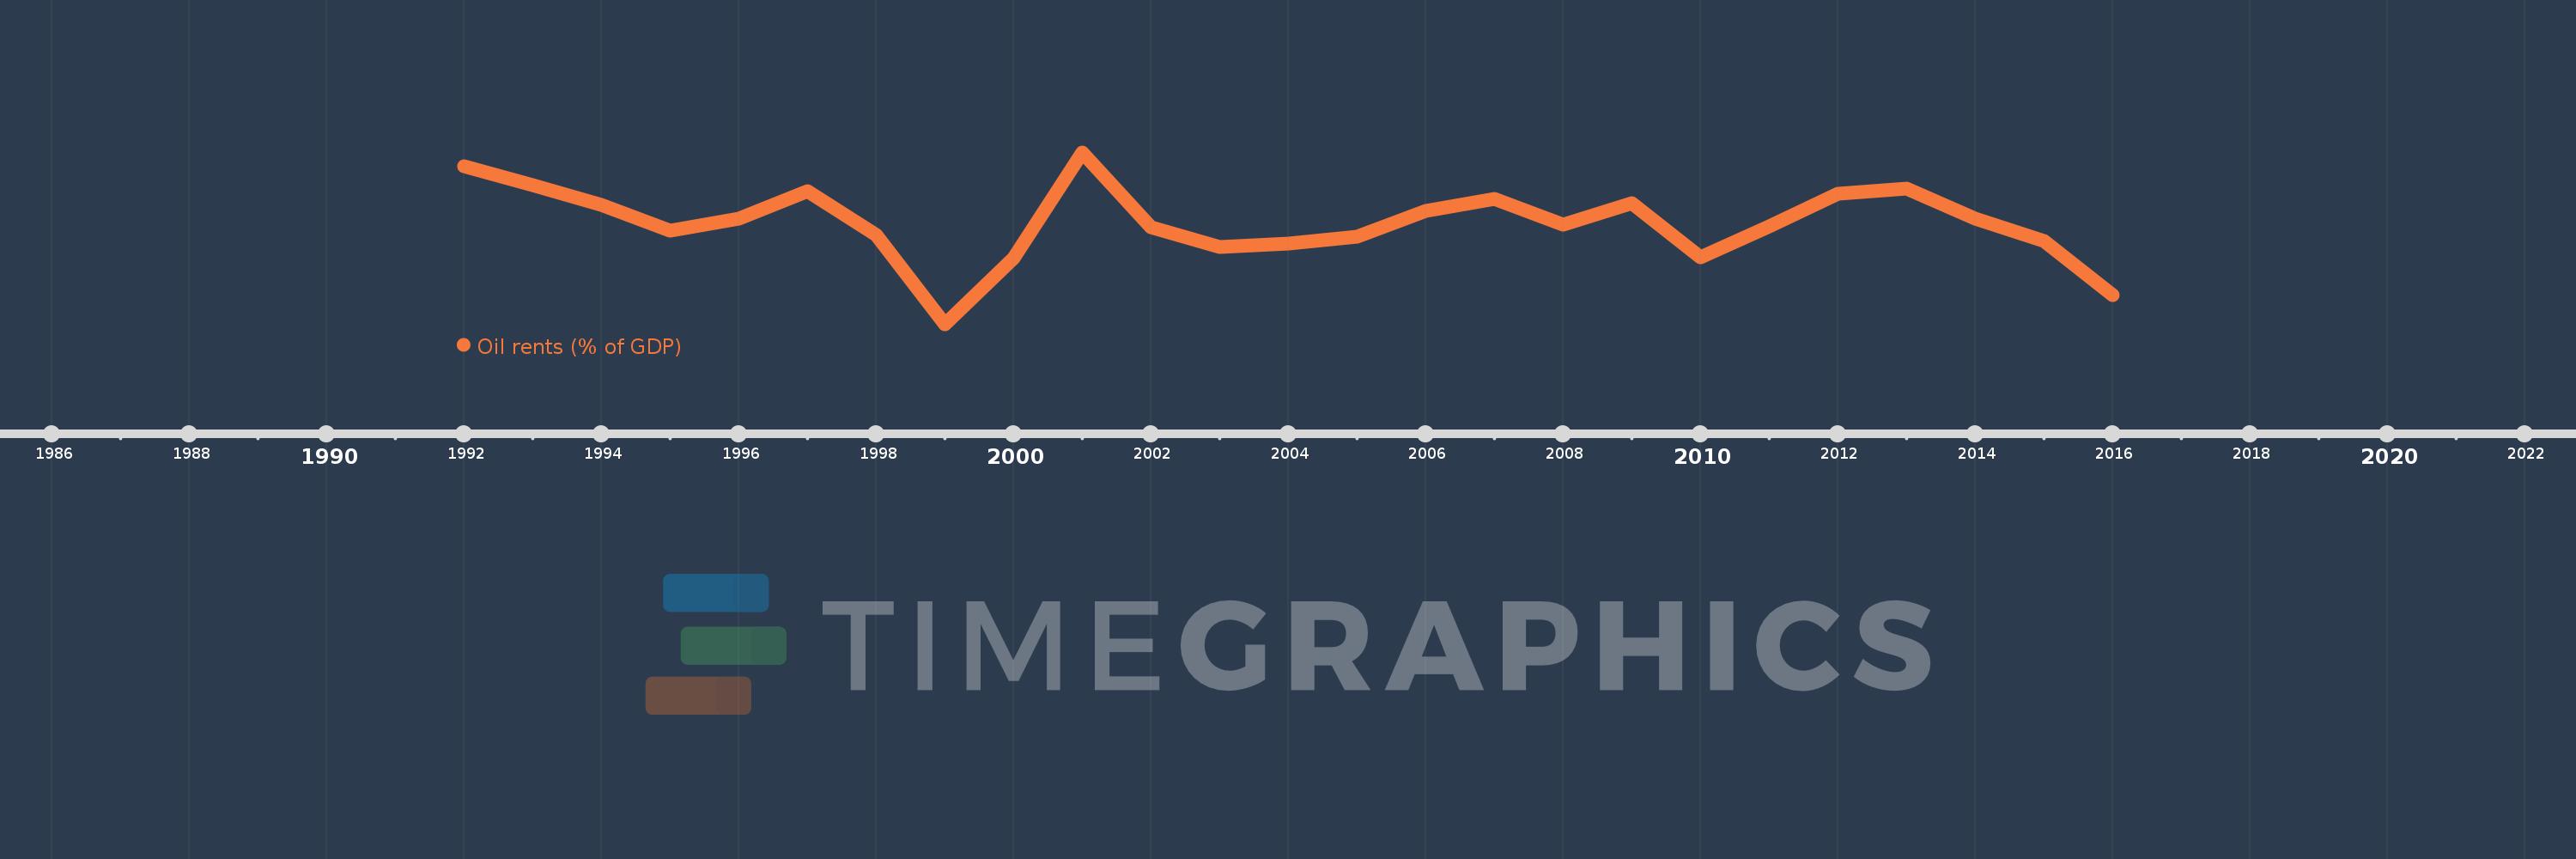
Oil rents (% of GDP)
2016,2015,2014,2013,2012,2011,2010,2009,2008,2007,2006,2005,2004,2003,2002,2001,2000,1999,1998,1997,1996,1995,1994,1993,1992
This statistics in other country:
Timeline:
This timeline shows a graph from 1992 to 2016 of Hungary. No data until 1991. Number of actual observations by date: 25.
Source name:
World Development Indicators
Source organization:
Estimates based on sources and methods described in "The Changing Wealth of Nations: Measuring Sustainable Development in the New Millennium" (World Bank, 2011).
Categories, topics:
Energy & Mining, Environment
Last updated:
apr 23, 2017
Indicators value changes by year
At the date of observation
Value
Absolute change
Change from previous value
jan 1, 1992
0.262
+0.262
0.0%
jan 1, 1993
0.234
-0.027
-10.49%
jan 1, 1994
0.205
-0.029
-12.34%
jan 1, 1995
0.168
-0.038
-18.44%
jan 1, 1996
0.185
+0.017
10.16%
jan 1, 1997
0.225
+0.041
22.01%
jan 1, 1998
0.161
-0.064
-28.43%
jan 1, 1999
0.031
-0.13
-80.9%
jan 1, 2000
0.127
+0.096
311.22%
jan 1, 2001
0.282
+0.155
122.43%
jan 1, 2002
0.173
-0.109
-38.71%
jan 1, 2003
0.144
-0.028
-16.32%
jan 1, 2004
0.149
+0.005
3.13%
jan 1, 2005
0.159
+0.01
6.72%
jan 1, 2006
0.196
+0.037
23.6%
jan 1, 2007
0.214
+0.018
8.96%
jan 1, 2008
0.176
-0.037
-17.52%
jan 1, 2009
0.208
+0.032
17.87%
jan 1, 2010
0.129
-0.079
-37.94%
jan 1, 2011
0.174
+0.045
34.77%
jan 1, 2012
0.222
+0.048
27.51%
jan 1, 2013
0.229
+0.007
3.26%
jan 1, 2014
0.185
-0.044
-19.33%
jan 1, 2015
0.153
-0.031
-17.03%
jan 1, 2016
0.074
-0.079
-51.82%
Ranking of countries by current statistics by years


Comments: