29
/
en
AIzaSyAYiBZKx7MnpbEhh9jyipgxe19OcubqV5w
April 1, 2024
181477
Lithuania
LTU
true
2
1
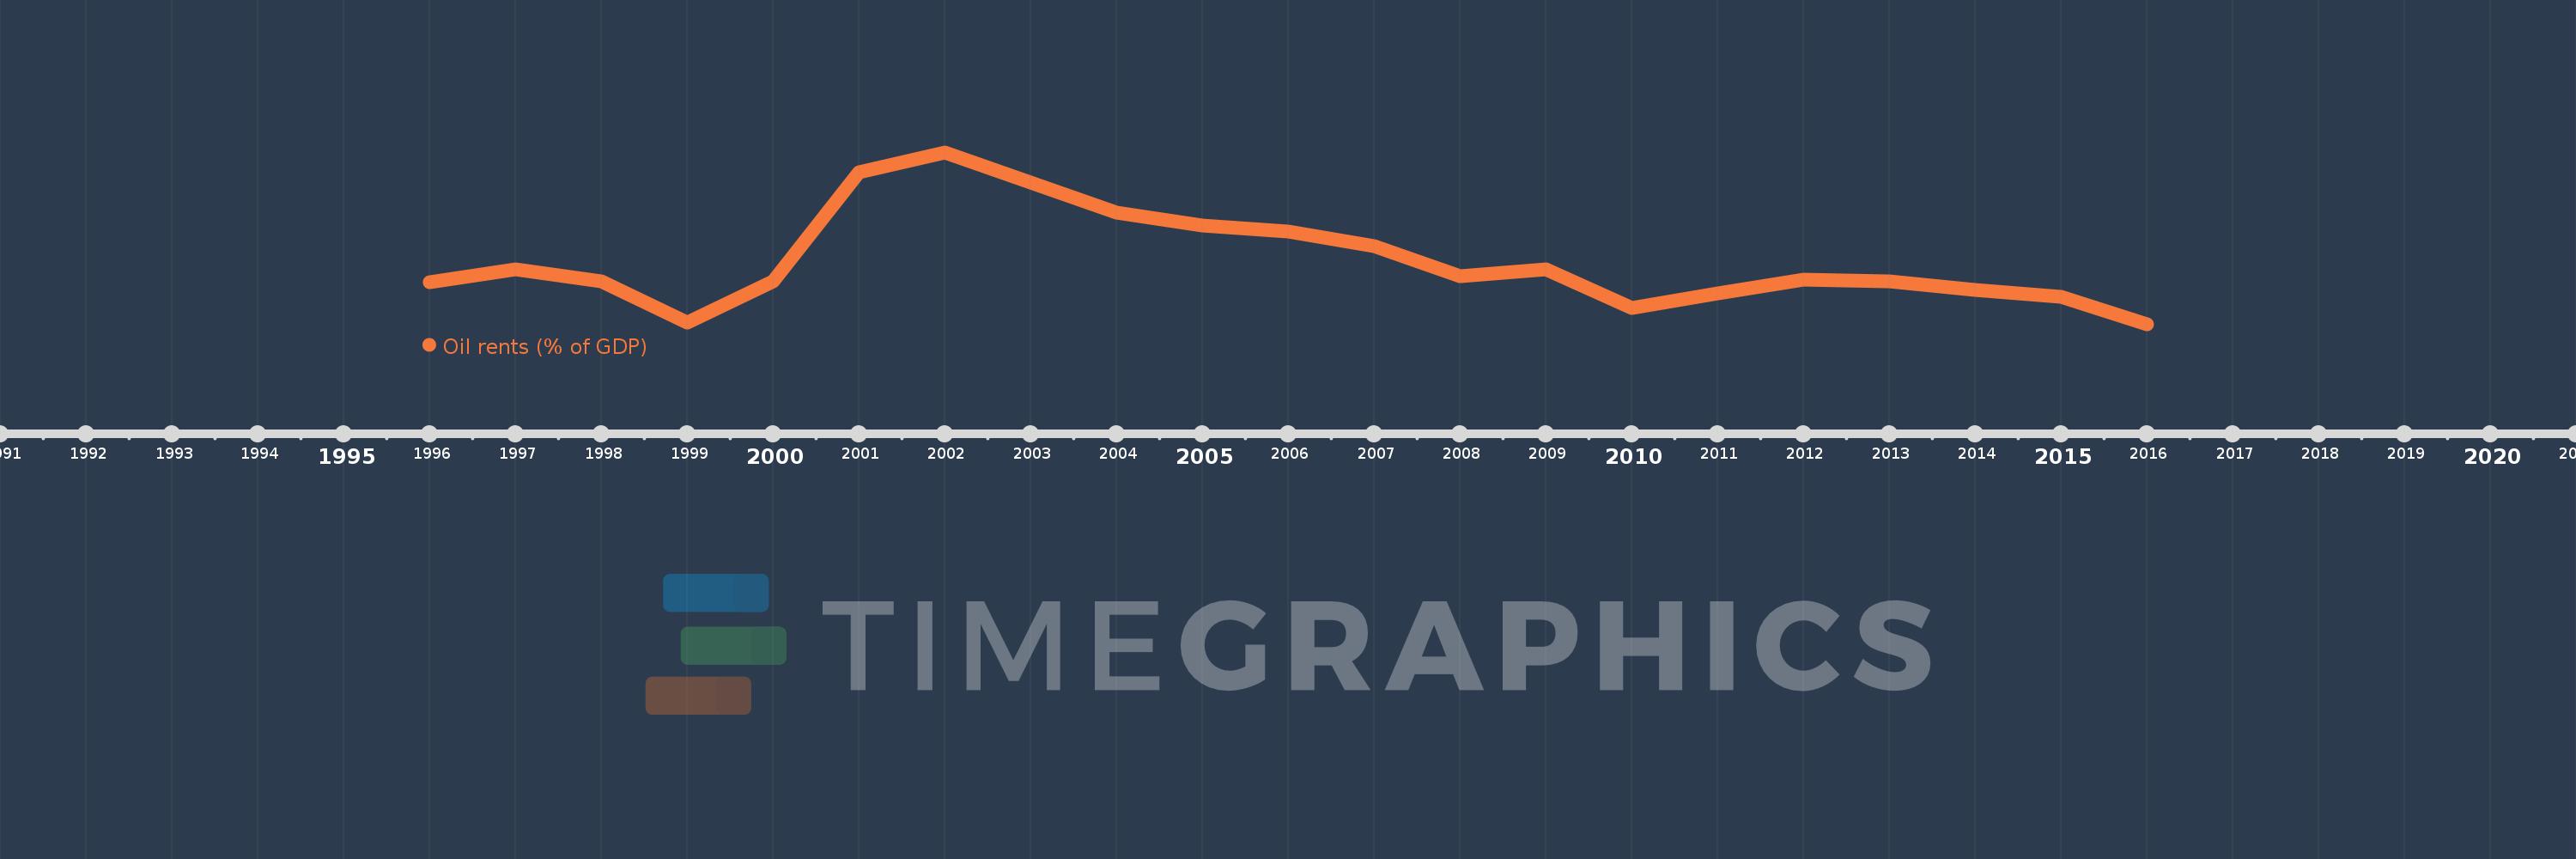
Oil rents (% of GDP)
2016,2015,2014,2013,2012,2011,2010,2009,2008,2007,2006,2005,2004,2003,2002,2001,2000,1999,1998,1997,1996
This statistics in other country:
Timeline:
This timeline shows a graph from 1996 to 2016 of Lithuania. No data until 1995. Number of actual observations by date: 21.
Source name:
World Development Indicators
Source organization:
Estimates based on sources and methods described in "The Changing Wealth of Nations: Measuring Sustainable Development in the New Millennium" (World Bank, 2011).
Categories, topics:
Energy & Mining, Environment
Last updated:
apr 23, 2017
Indicators value changes by year
At the date of observation
Value
Absolute change
Change from previous value
jan 1, 1996
0.103
+0.103
0.0%
jan 1, 1997
0.126
+0.023
22.24%
jan 1, 1998
0.104
-0.022
-17.53%
jan 1, 1999
0.029
-0.075
-72.29%
jan 1, 2000
0.104
+0.075
260.16%
jan 1, 2001
0.302
+0.198
191.19%
jan 1, 2002
0.338
+0.035
11.74%
jan 1, 2003
0.284
-0.054
-16.0%
jan 1, 2004
0.229
-0.054
-19.09%
jan 1, 2005
0.205
-0.025
-10.81%
jan 1, 2006
0.195
-0.01
-4.92%
jan 1, 2007
0.168
-0.026
-13.57%
jan 1, 2008
0.113
-0.055
-32.72%
jan 1, 2009
0.126
+0.012
11.04%
jan 1, 2010
0.056
-0.07
-55.33%
jan 1, 2011
0.082
+0.026
46.77%
jan 1, 2012
0.107
+0.025
30.37%
jan 1, 2013
0.104
-0.003
-2.99%
jan 1, 2014
0.089
-0.015
-14.87%
jan 1, 2015
0.075
-0.014
-15.52%
jan 1, 2016
0.026
-0.049
-64.83%
Ranking of countries by current statistics by years


Comments: